My Trading Bot Was Quietly Costing Me 7.8% a Year. It Took Claude to Notice.
Generated through Gemini
On April 7, 2025, somewhere near the bottom of the tariff crash, my trading bot sold three of its four positions. It wasn’t supposed to be trading that day. It wasn’t supposed to be trading that week. And, I didn’t find out for another eighteen months.
Two and a half years ago, I backtested Hybrid Asset Allocation (HAA) and liked what I saw: steady growth, small drawdowns, a strategy that quietly steps aside when the market turns ugly. So I put it live. Steady, it turned out, was a polite word for slow. From June 2024 to October 2026, my account compounded at 8.2% a year while SPY did 17.0%, and the drawdown protection I’d signed up for came in about 2 percentage points better than simply holding the index. I didn’t assume HAA was broken. I thought it was just sluggish, and that it would surge someday.
So I went looking: a stack of papers on tactical asset allocation, each promising a way to make strategies like HAA react faster or hold up better. The plan was simple. Test the best ideas, keep the winner.
The plan lasted about ten minutes.
Previous readings
- Testing the Waters - Backtesting HAA and Its Variations Towards Success (Part I)
- 【How 2】 Escape Interactive Brokers’ Connection Trap with the Help of AI
I asked for a report card. I got a bug report.
Before testing anything new, I wanted a baseline. I handed Claude my live trading records and the strategy code, and asked it to compare HAA’s live performance against SPY buy-and-hold.
It came back with a question instead of a report: why does your live account look nothing like your own backtest?
Claude used QuantConnect’s cloud backtesting through the LEAN CLI to re-run the exact rules my live bot was supposed to be following. From June 2024 to July 2026, a backtest of the exact same rules returned 16.99% a year, basically tied with SPY. My live account, over the same window, returned 9.20%. Same rules, same volatility, and about 7.8% a year lost between the strategy I thought I was running and the one I actually was. The worst month was April 2025: the backtest lost 1.1%; my account lost 8.6%.
Claude traced it to two problems in my live code. Only one of them was a surprise.
- No rebalance after a drop. When the code dropped an ETF for negative momentum, it never re-weighted the rest, so the leftover money just sat in cash. I’ll admit this one was deliberate. Re-weighting means more orders, and more orders means more commission.
- Trading when it shouldn’t. HAA rebalances once a month. But in any month where it hadn’t placed a buy order, my code went back and re-checked the signals every single day. So there’s April 7: EFA, PDBC and EEM sold near the low of the tariff crash, on a day the strategy had no business trading.
And here’s the part I never saw coming. Those two aren’t independent — my fee-saving choice is what kept setting off the second bug. No rebalance meant no buy order that month. No buy order meant my automated trading bot, which only ever counted buys, reported that the month hadn’t traded yet. So the bot went back to checking signals daily, sold something mid-month, and still didn’t buy. Which left the following month in exactly the same state.
Between June 2025 and September 2026, there were twelve months in which my bot only ever sold.
The strategy wasn’t sluggish. My implementation was.
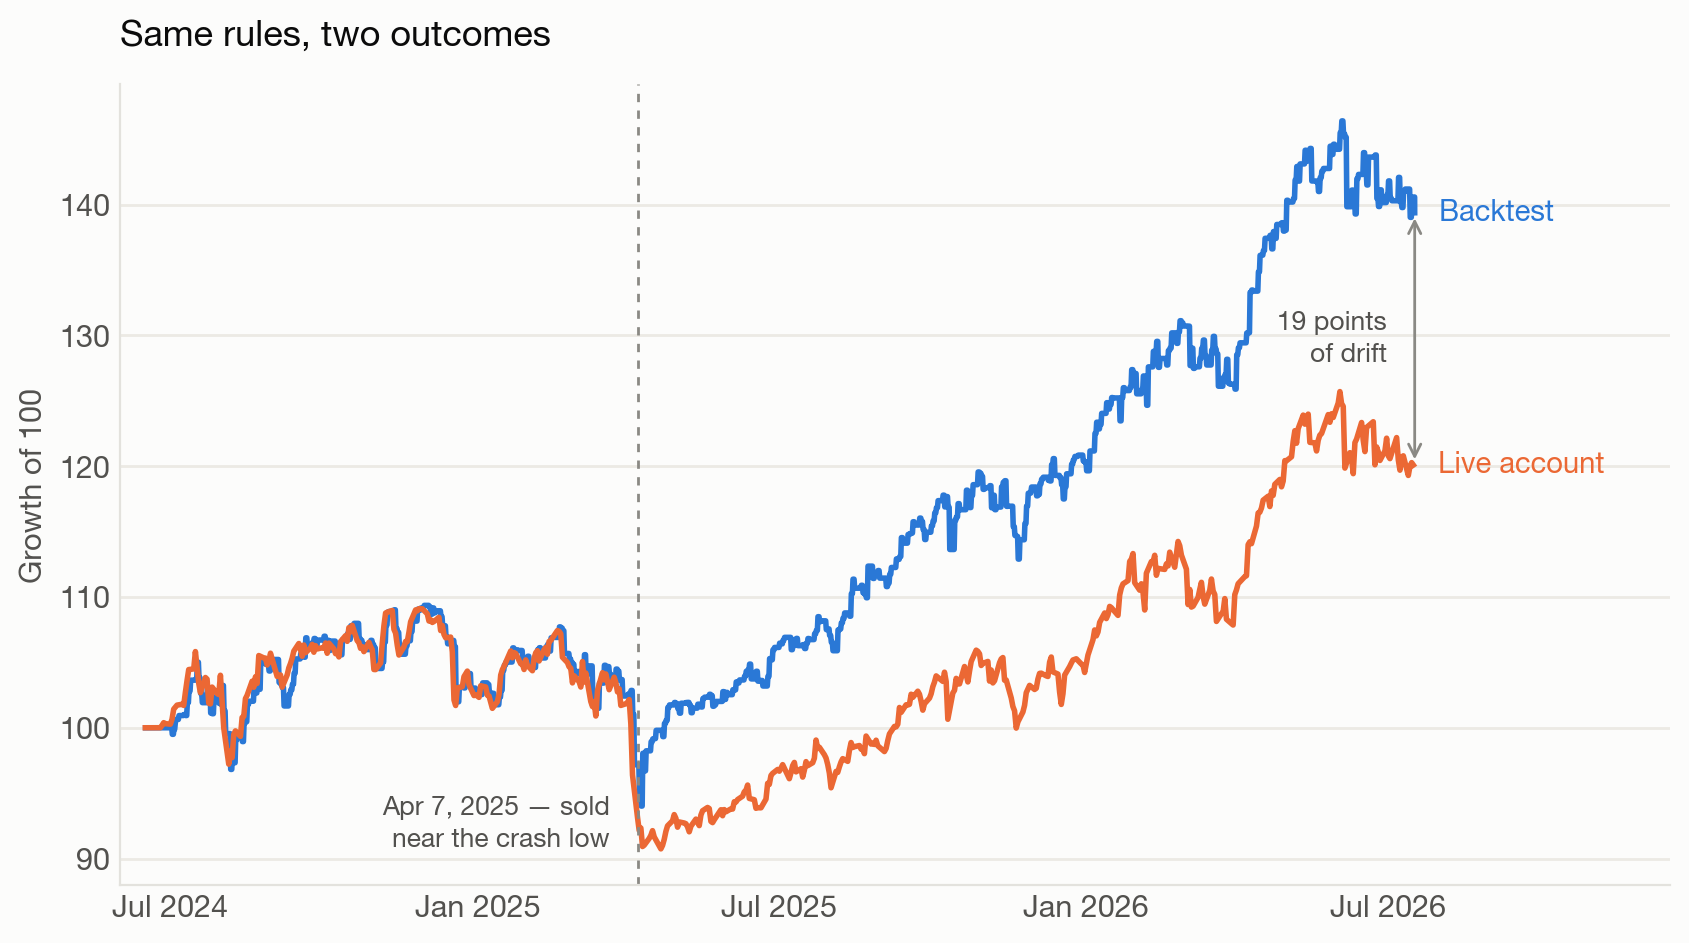
My live account against a backtest of the identical strategy, both indexed to 100. They are the same line until April 2025.
Look at where those lines separate. For the first ten months they’re almost indistinguishable: the fee-saving shortcut, on its own, was costing me very little. Then April 2025 arrives and they never touch again. Before that day the gap was running at about 4.9 percentage points a year. After it, 10.7. The bug didn’t simply exist. It switched on.
7.8% a year. That is an enormous amount to lose to anything, let alone to a decision I’d made on purpose to save a few dollars in commission. One missing test case, and the fee I’d been so careful to protect turned out to be the cheapest item in the whole equation. I was furious with myself.
Two AIs, two jobs
Fixing the bugs became a back-and-forth with Claude: it proposed a fix, I questioned it, it checked the fix against the backtest. My job was to make sure the data it referred to, the logic it wanted to apply, and the change I’d asked for all stayed inside the project’s scope. And somewhere in that back-and-forth I realized something: I could finally spend more time on the part I’d actually signed up for. Reading the papers.
For the papers, I used Gemini, mostly because it’s free, and long PDFs are exactly what it’s good at. I’d feed it a paper and ask for the one thing that mattered to me: how could the ideas in this paper actually benefit my strategy, and can a retail account with free data pull it off? Then I read the relevant sections myself to check that the summary was right.
That second question turned out to matter as much as the first. Half of what I read was about what not to test. Perona-Malik filters looked brilliant in their paper, but with that many moving parts, they’re an overfitting machine for an account with limited capital. Macro regime models built on 127 FRED-MD indicators run into publication lag and data revisions that a backtest never sees. Sector ETFs were out too: they’re about 0.8 correlated with each other, which defeats HAA’s whole cross-asset point.
What survived became six single-change variants, each traced to a source:
- V1a: defend with whichever of IEF or BIL is stronger (Keller’s original HAA)
- V1b: swap in BAA’s 12-asset offensive universe (Keller’s BAA)
- V2a / V2b: BAA’s four-ETF canary, triggered by one bird or by two birds (quanterlab)
- V3: rebalance in four weekly tranches (Gabriel, Pagani & Zarattini’s update of Faber’s GTAA)
- V6: hold only the top 2 (The Marginal Cost of Diversification)
Six variants in ninety minutes, and the winner I already had
Here’s the part that surprised me most. Claude rebuilt the backtest as a single QuantConnect script where every variant is just a set of parameters. Then it ran them all and pulled the results together. Before trusting it, I had it reproduce my 2024 article: 9.94% a year against the original 10.01%. Close enough.
Then I checked my time log. In my previous Part I, testing four variants took me 6.2 hours, every one of them hands-on. Part II took 4.5 hours — but 3 of those were reading papers, which leaves about 90 minutes of actually running the research. And those 90 minutes weren’t even dedicated: I was discussing direction with Claude in one window and working through unrelated tickets in another, because a backtest runs whether you’re watching it or not.
Ninety minutes of my attention bought six variants, two baselines, a data audit of 25 ETFs, and the discovery of that 7.8% gap.
Fast testing has a trap, though. If you can test six variants in an afternoon, you can test sixty and keep going until one looks amazing. So I locked the rules before running anything. To win, a variant had to beat my current rules by at least 0.10 Sharpe on 2008–2019, keep max drawdown under 20%, and hold up in at least two of three sub-periods. The 2020–2026 period would be run exactly once, for information only.
| What changed | Training Sharpe (2008–2019) | Test Sharpe (2020–2026) | 2022 | |
|---|---|---|---|---|
| B0 | My live rules | 0.919 | 0.910 | -4.5% |
| B1 | Keller’s original HAA | 0.835 | 1.153 | +4.0% |
| V1a | IEF/BIL defense | 0.883 | 1.138 | +5.7% |
| V1b | BAA 12-asset universe | 0.793 | 0.900 | -8.9% |
| V2a | 4-ETF canary, one bird | 0.957 | 0.368 | -15.7% |
| V2b | 4-ETF canary, two birds | 0.766 | 0.537 | -16.9% |
| V3 | Weekly tranches | 0.742 | 0.654 | -10.1% |
| V6 | Top 2 only | 0.606 | 0.669 | +0.4% |
The bar was 1.019. Nothing cleared it; the closest was V2a at 0.957.
Six papers. Zero winners. The best version of HAA turned out to be the one I’d already written down in 2024 — and then failed to run properly.
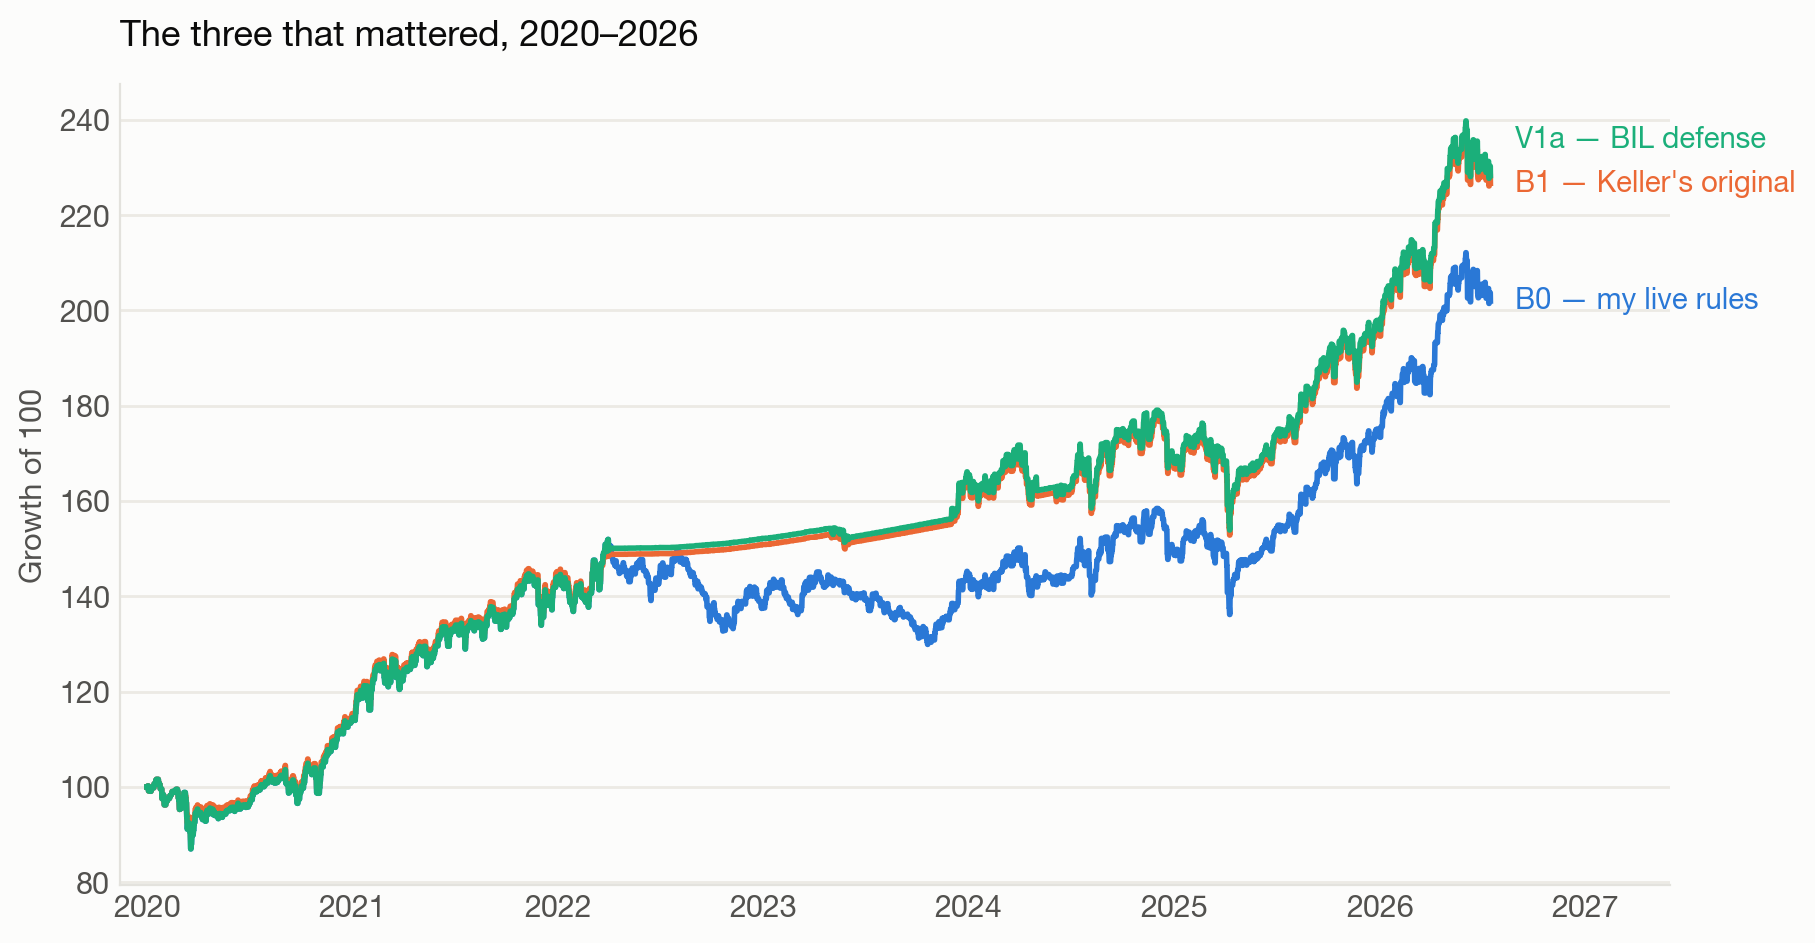
B0 (my live rules), B1 (Keller's original) and V1a (BIL defense) across the 2020–2026 test period
The tweaks failed for related reasons. The two-bird canary cut false alarms but sounded the real ones late. Weekly tranches split the crash switch into quarters, which was far too slow in 2008 and 2020. Holding only the top 2 threw away the cross-asset diversification HAA depends on. And V1b and V2a each borrowed half of another Keller model, leaving behind the BIL floor that made the other half work.
There was one more lesson, and it was hiding in the 2022 column. From March 2022 to October 2023, HAA’s TIP canary kept me on defense for 20 months as rates climbed. My defensive asset, IEF, lost 8.5% over that stretch; BIL, plain short-term T-bills, gained 5.8%. The two variants that could hide in BIL made 4–6% in 2022. The ones stuck with IEF ranged from roughly flat to a 17% loss. My training window couldn’t see this: 2008 to 2019 was a falling-rate era, so bonds always protected.
In Part I, I’d defined HAA’s defense as IEF alone. I’d left out the BIL leg of Keller’s design without ever realizing it was the part carrying the weight. Two years of hiding in the wrong shelter, and I’d built the shelter myself.
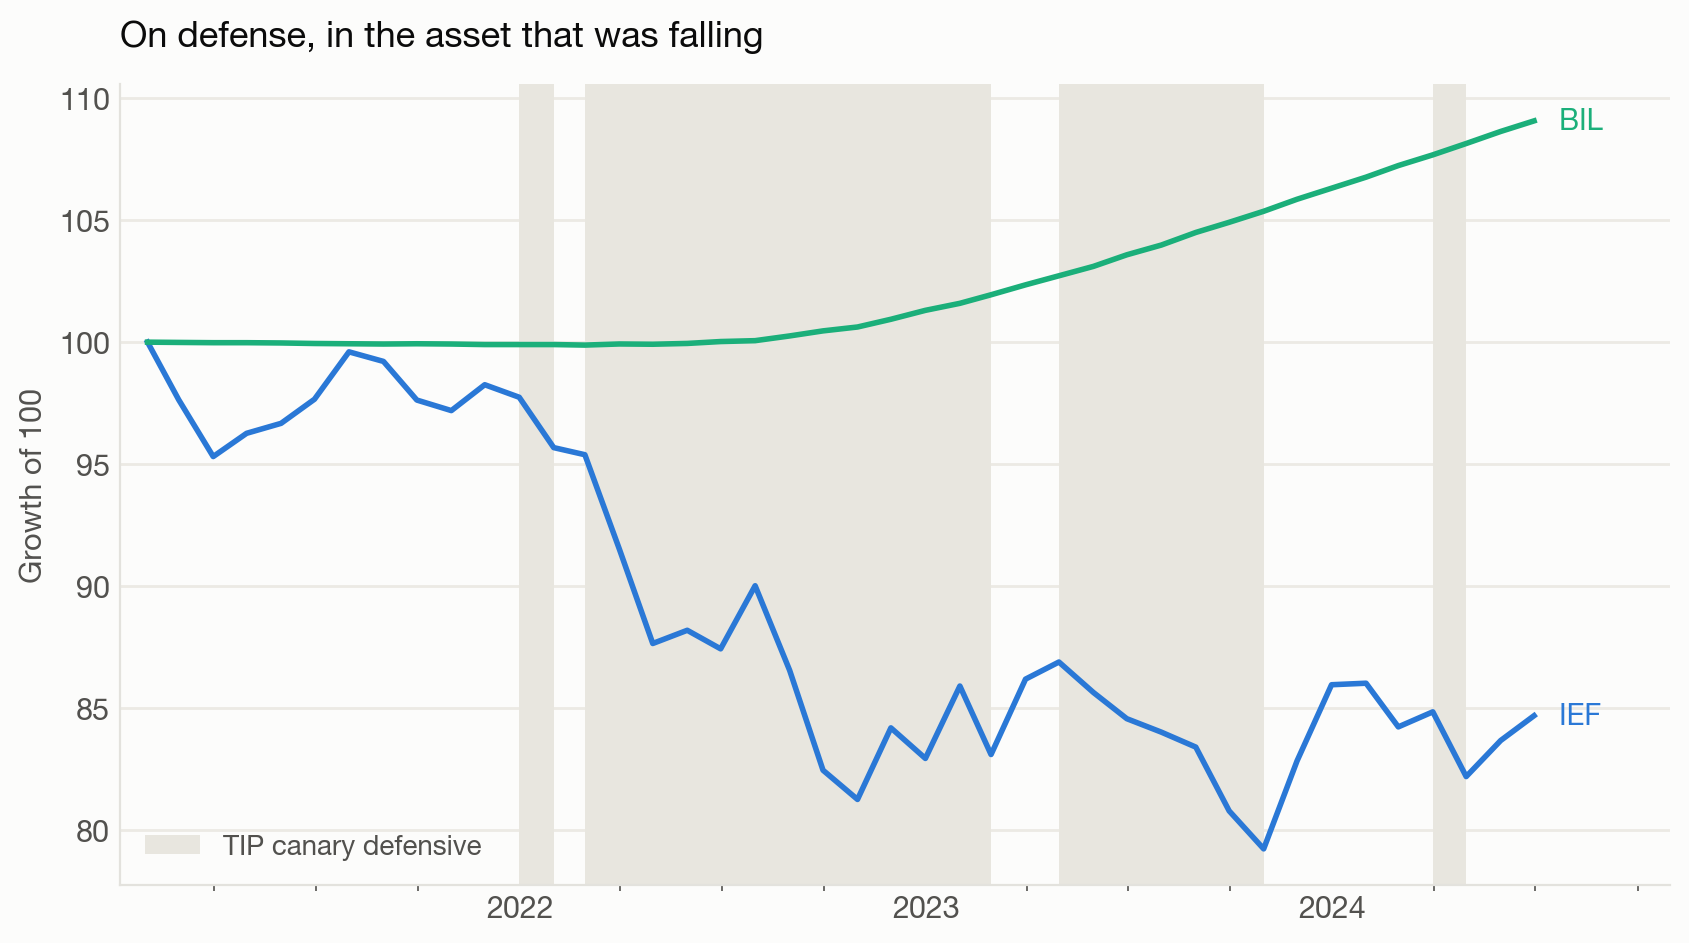
Twenty months on defense while the defensive asset fell — TIP canary state vs IEF and BIL cumulative returns, 2021–2024
Where the hours went
The strategy barely changed. The way I work changed completely.
Part I took 6.2 hours, and my time log files every one of them under programming. There isn’t a single entry for reading the HAA paper. Part II inverted that completely, and still came out ahead: several times the output the old way would have given me in the same hours.
But here’s the detail I find most interesting, and it’s the one that doesn’t show up in any “AI made me 10x faster” post: the reading didn’t get faster. If anything it got slower, because I was finally doing it properly. What collapsed was the other half — the writing, the debugging, the staring at a backtest that won’t reproduce. That half went from being the whole job to something I merely supervise, handed off to an assistant that is possibly smarter than me and definitely more tireless.
I used to spend maybe 30% of a project thinking and 70% fighting with code. This time it was closer to 90/10, and the 10 wasn’t really coding. It was me reading what Claude had written and deciding whether to trust the number that came back.
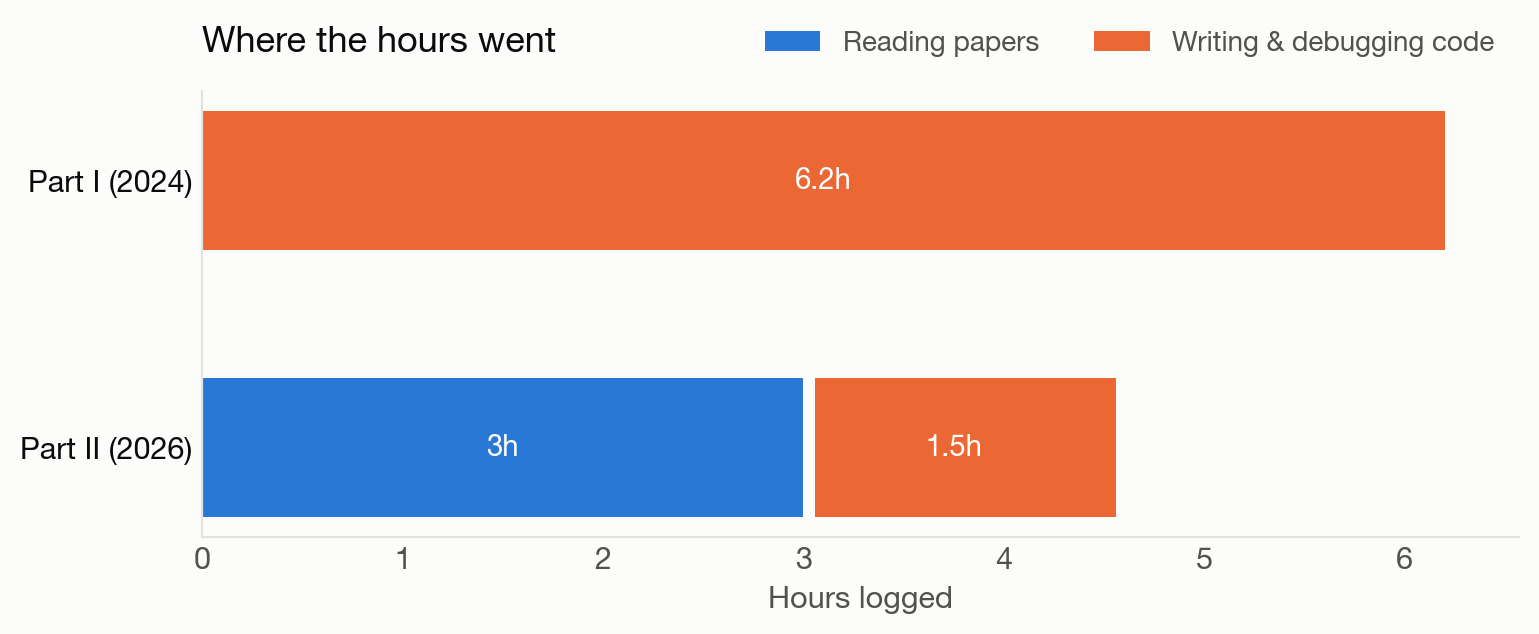
Part I vs Part II: hours spent reading versus hours spent building
However, that second job still needed me. Order-level diagnostics caught three silent bugs in the new backtest script: a first month spent entirely in cash, a full switch rejected for buying power, and two variants starting two months late. All three were QuantConnect quirks that Claude’s new script hadn’t accounted for, and none of them raised an error. Any one of them would have quietly skewed a result. And the hardest call was mine alone: V1a fails my own pre-locked rules on the training period, yet I’m adopting its BIL defense anyway, as a documented exception that only live trading can prove right.
So that’s the plan: fix the live code until it matches the backtest month by month, then add BIL to the defense. I’ll report back once there’s enough live data to say whether it worked.
But if there’s one thing worth stealing from all this, it isn’t that AI writes decent backtest code, though it does. It’s that I ran a strategy with real money for two years on the quiet assumption that my code did what I believed it did, and in all that time I never once asked for a second pair of eyes. That second pair of eyes took ninety minutes and found 7.8% a year.
Go read your own code. Better still, get something else to read it for you.
Reference
- Dual and Canary Momentum with Rising Yields/Inflation: Hybrid Asset Allocation (HAA)
- Keller, W. J. & Keuning, J. W. — Bold Asset Allocation (BAA), SSRN, 2022
- A Quantitative Approach to Tactical Asset Allocation (Faber)
- Gabriel, M., Pagani, A. & Zarattini, C. (2025). Global Tactical Asset Allocation: Updated Results and Real-Market Implementation Using Python and IBKR. QuanTips #1.
- The crash switch worked and the strategy starved anyway: Keller’s menu tested (quanterlab)
- Weibel, M. (2026). Edge-Preserving Macro-Financial Signal Extraction for Real-Time U.S. Sector Rotation. Zurich University of Applied Sciences.
- Bailer, H. & Alber, S. (2026). A Causal Regime–Risk–Stability Framework for Global Tactical Asset Allocation.
- Oliveira, D. C., Sandfelder, D., Fujita, A., Dong, X. & Cucuringu, M. (2025). Tactical Asset Allocation with Macroeconomic Regime Detection. arXiv:2503.11499
- Bessler, W., Taushanov, G. & Wolff, D. (2021). Factor investing and asset allocation strategies: a comparison of factor versus sector optimization. Journal of Asset Management, 22, 488–506
- Sanford, A. (2026). The Marginal Cost of Diversification.
- How to Improve ETF Sector Momentum (Quantpedia)