
Photo by Priscilla Du Preez on Unsplash
Backtrader is a well-known Python open-source library to backtest your quantitative trading strategy. Most of its components can support trading against one single trading target. To step up the game to trade against multiple stocks, there are a few things that need to be fine-tuned to make sure the trading strategy would trade as you expected. In this post, I’m going to share my experience and crucial tips with you as a starting point to build your own.
Become a Medium member to continue learning without limits. I’ll receive a small portion of your membership fee if you use the following link, at no extra cost to you.
If you enjoy reading this and my other articles, feel free to join Medium membership program to read more about Quantitative Trading Strategy.
Previous researches
- 【How 2】Set Up Trading API Template In Python
- 【How 2】 Vol. 4. How to produce the S&P 500 Historical Components & Changes
- 【How 2】 Vol. 3. How to produce quality tradable securities for backtesting
Introduction
Backtrader is a well-known Python open-source library that allows you to use it for backtesting, strategy visualization, and live trading. Unfortunately, active development stopped in about 2018 with only a few bug fixes being merged here and there, but it is still considered to be one of the important beginner’s backtesting tools to get familiar with the framework and crucial components in quantitative trading.
As said, a few things needed to be taken care of to move on to the next phase from trading one single target such as stock, ETF, or bond to trading multiple stocks. I’m going to use one of my trading strategies which trades against stocks that have high IC/IR ratios to demonstrate the differences between before and after the changes. Of course, let me know if you’re interested in knowing this trading strategy. I’ll draft another post if I find out it will help certain people.
1. How to add data from multiple stocks
The first thing to trade against multiple stocks is for sure to add data of different symbols into your backtrader cerebro. Below is the method that the official guide suggested to add data to your script:1
2
3
4
5
6
7
8
9
10
11
12
13
14
15
16
17
18
19
20
21
22import backtrader as bt
import pandas as pd
start_date = datetime.datetime(2022, 11, 28)
end_date = datetime.datetime(2023, 6, 12)
cerebro = bt.Cerebro()
df = pd.read_csv(csv_file_path)
data = bt.feeds.PandasData(
dataname=df,
fromdate=start_date,
todate=end_date,
name=ticker,
datetime=0,
close=6,
high=7,
low=8,
open=9,
volume=10,
openinterest=-1,
)
cerebro.adddata(data)
Method to add data suggested by the official guide
The way I added multiple symbols data into cerebro is:
- Stitched all the data into one big
csvsheet. - Added
dateandtickerto remark the date and the symbol name of the data. - Looped through each ticker and sorted by
dateto add the data needed - Added
nameparameter into the loader function to remark the name of the data
1 | cerebro = bt.Cerebro() |
Method to add data of multiple symbols
There you go!
2. Wait! What happens to my plotting visualization?
One of the features that backtrader is noted for is its plotting feature together with matplotlib library. This is how you enable this feature in your script:1
2# After you run cerebro.run()
cerebro.plot()
How to enable the plotting feature
See! It’s that easy! But the thing is, once you add this line of code into our multiple stocks trading strategy script, it’s going to look like this:
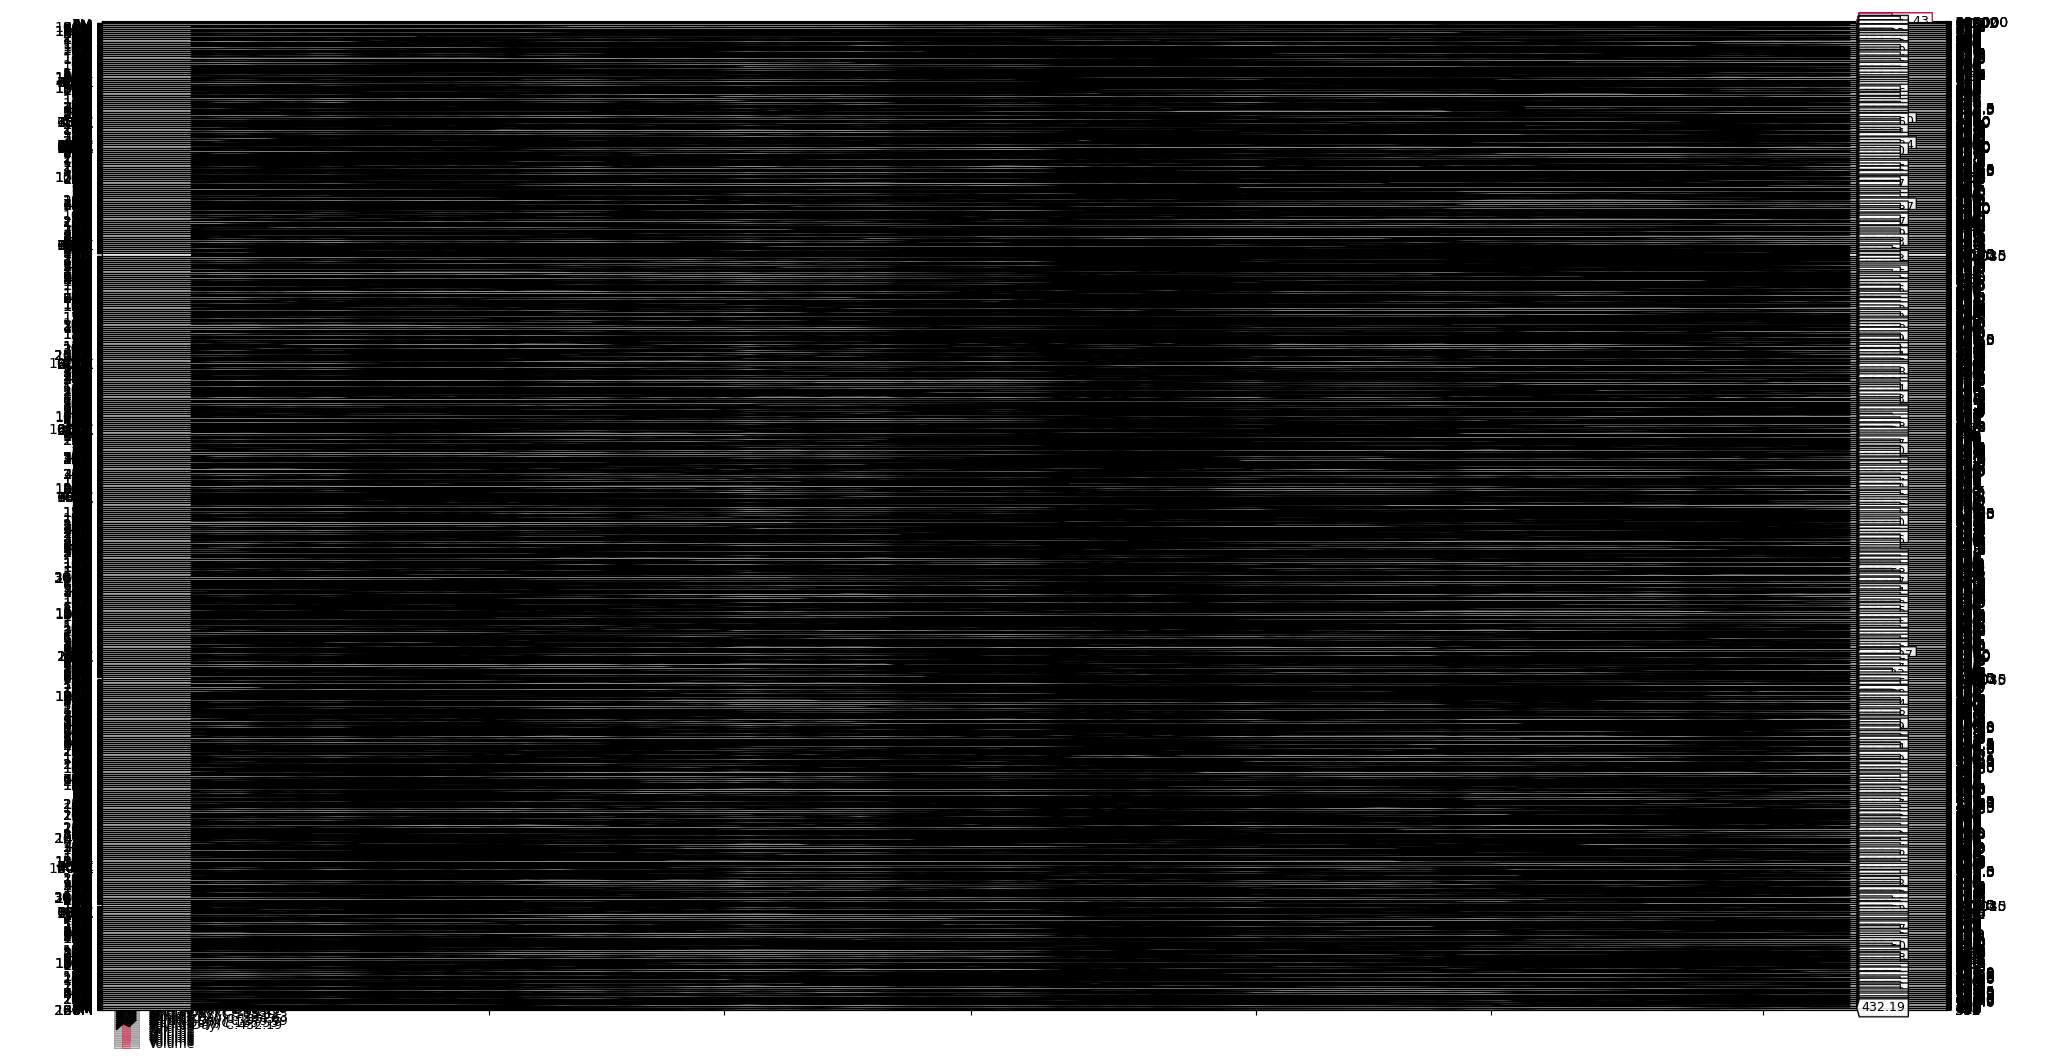
The default diagrams when enabling the plotting feature
Obviously, there are too many price data lines that have been plotted in one single diagram. In order to make your diagram to be more readable, there are a few twists to be made:
2.a. Disable the default data plotting
To do this, you have to disable the default plotting features and build your own plots.
First, you set the plot parameter in the data loader to False.1
2
3
4
5
6
7
8
9
10
11
12
13
14data = bt.feeds.PandasDatar(
dataname=df1,
fromdate=start_date,
todate=end_date,
name=ticker,
datetime=0,
close=6,
high=7,
low=8,
open=9,
volume=10,
openinterest=-1,
plot=False
)
2.b. Disable the default backtesting plotting
Backtrader also embeds a few default plots when you enable the plotting feature. Let’s also disable them for now.
1 | cerebro = bt.Cerebro( |
2.c. Add your customized plot
Lastly, the default plot is used to plot the price/value movement of a single stock. We need to transform the diagram into the way want it to be. Let’s add a customized observer to replace the original plot. In this plot, there are going to be two lines plotted: one is our benchmark data which is set to SPY. The second line would be the portfolio value. Here’s how we do this:
1 | class BenchmarkBroker(bt.Observer): |
Customized observer class to show both portfolio value and benchmark value
In the end, you’ll get the following plot after running your backtest:
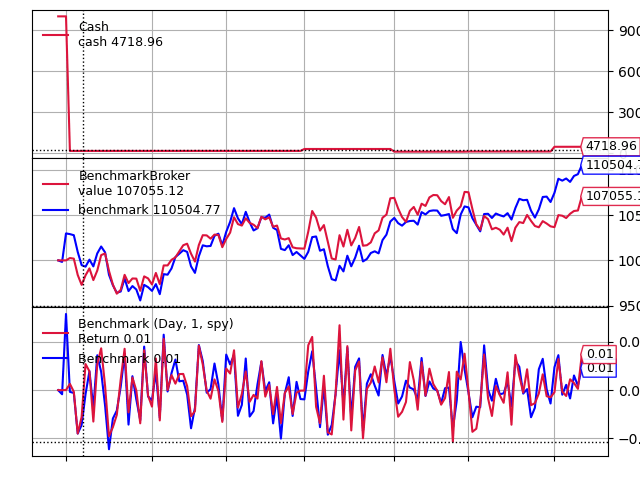
The final plotting we just built to track the movement of our portfolio value against the benchmark value
3. Hey! The start date and the end date won’t match my customized plot!
I’ve been running backtests over and over again, and this issue bothered me for a long long time. Initially, I suspected it would be the problem of the missing price data as some of the symbols are either delisted or merged by the other corporations. So I tried not to import them into cerebro during the data importing stage. In the end, I found out that it caused the Forward bias in the algorithm. Then to eliminate this bias, I digged deeper and found this implicit rule hidden in the backtrader library:
- Scenario 1
- Data0 starts from 2018-01-02, end at 2018-01-30
- Data1 starts from 2018-01-02, end at 2018-02-07
- The missing stock price in data0 will be filled with the same price as 2018-01-30 throughout 2018-01-31 to 2018-02-07
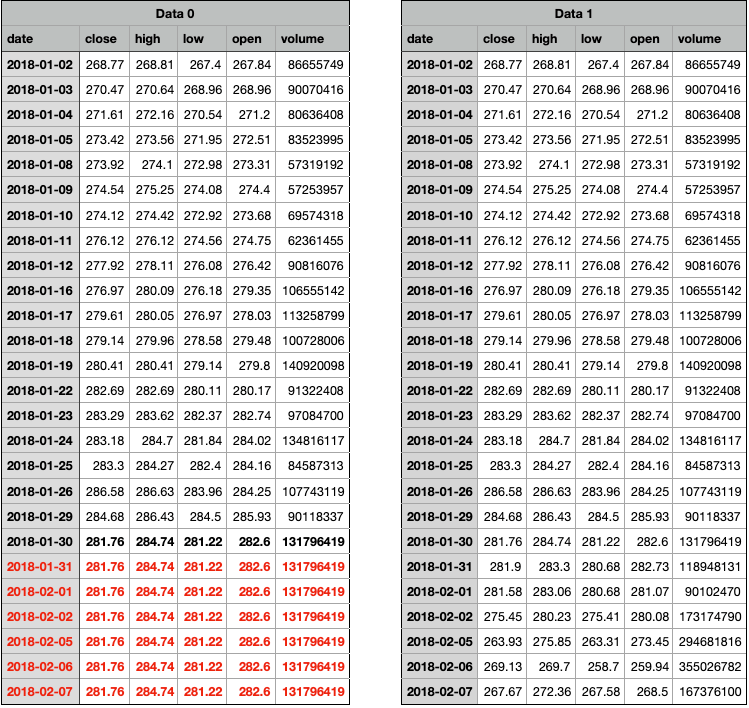
Missing data scenario 1
- Scenario 2
- Data0 starts from 2018-01-02, end at 2018-02-07
- Data1 starts from 2018-01-09, end at 2018-02-07
- The data from 2018-01-02 to 2018-01-08 in Data1 will be discarded because Data0 data is missing in this period. Therefore, the backtest won’t be performed during this particular period.
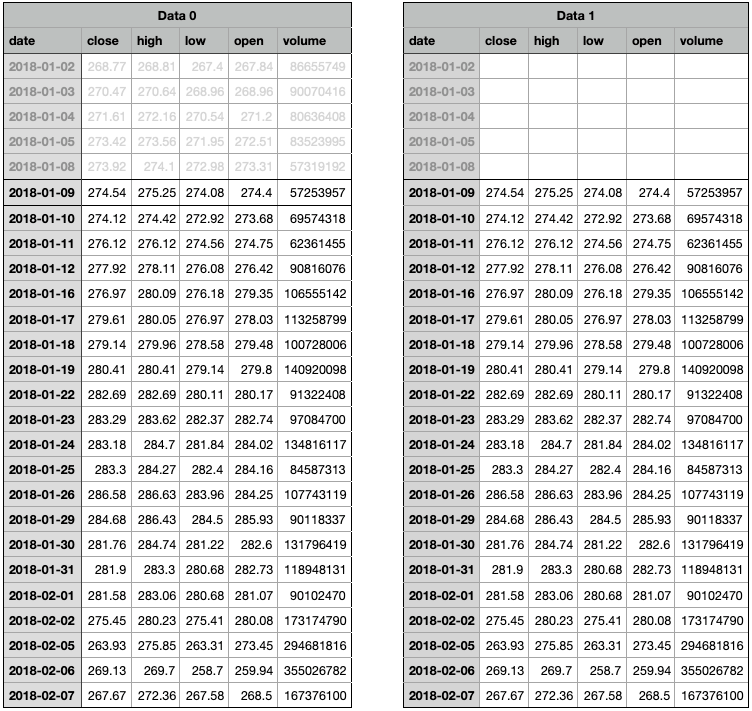
Missing data scenario 2
Apparently, the backtesting period can be limited by the data length of the symbol that has the least data rows. However, we need to make sure that the stocks staying in our trading universe can still be backtested with the participation of the early delisted stocks or the later added stocks, I came up with a trick to pull this off:
3.a. Use price data of SPY to produce the trading calendar
The first step would be using SPY to retrieve a series of trading dates. Then we use this trading calendar as the index for the data of every symbol to make sure every symbol shares the same index.
3.b. Fill NA
After resetting the index for every symbol, there are a lot of empty cells in your pandas dataframe being generated. Then we need to fill a certain value into these empty cells. Which value we should use? In backtrader, using None or NA would cause a lot of problems. Therefore, I choose 0 to easily identify and process.
3.c. Add 0 handling logic into your trading script
The last step would be adjusting the logic when processing your buy, sell, and close actions. Make sure you don’t place any orders when the price equals 0. It’s that easy to resolve this issue.
4. What? I don’t have enough money again? No way!
Once you have all the processes above set, you can start conducting your backtest and filling in your trading strategy. In my case, after I started running my backtest, I saw one prompt message that showed up multiple times and bothered me the most, which was "[ticker] Order rejected due to Margin order status". I checked here and there to see if there was anything wrong with my trading logic. I’ve made sure that I sell orders first to release the cash first, and then place the buy orders. I’ve also made sure the size of the order won’t exceed my available cash. How in the world that I still get this message all the time?
I’ve found two main reasons that cause this issue:
4.a. The time to execute the order
To clearly understand the order execution logic of backtrader, let’s refer to the backtrader’s documentation page:
Order.Market: A market order will be executed with the next available price. In backtesting it will be the opening price of the next bar.
So the problem is almost vividly portrayed. The close price of yesterday would potentially have a gap against today’s open price. This rule renders the possibility that the actual cost of placing an order would deviate from the estimated cost higher. In reality, quantitative traders who use daily pricing data to predict the stocks to be bought on the next day would place their orders the next morning, and the estimated cost wouldn’t greatly deviate a lot from the actual cost. So how do we produce an effect that is similar to what is happening in real life?
Cheat On Open is mentioned in the backtrader’s documentation page.
1 | cerebro = bt.Cerebro( |
Enabling the cheat_on_open feature with the parameter above, you’ll gain access to an extra function named next_open which is similar to the timing of entering the market if using only open price to place any of your order.
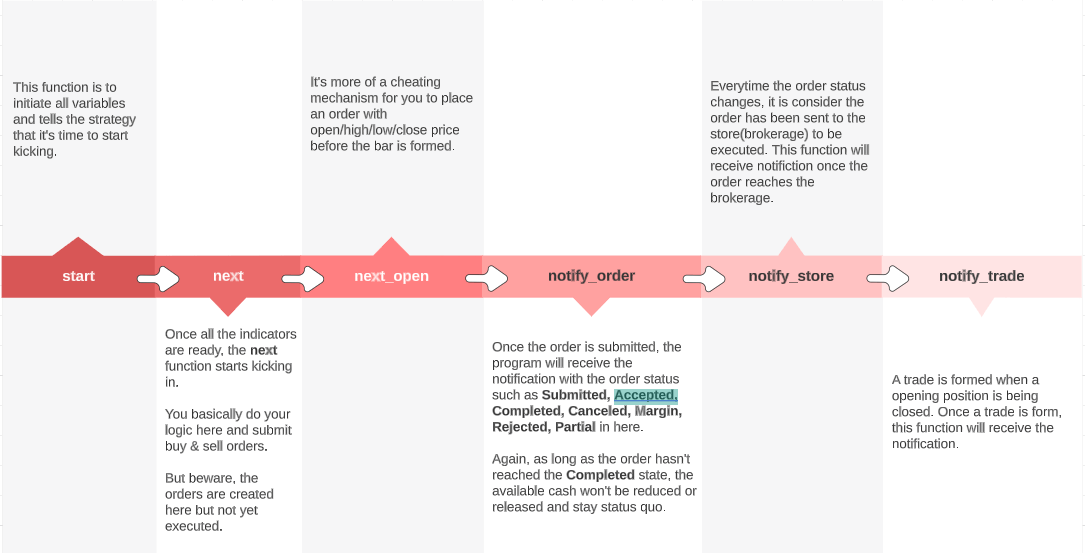
The process after enabling "cheat_on_open" feature
By doing this, you’ll be able to use the open price of the next day to place the buy/sell order, which will greatly decrease the difference in the overnight price gap. This also helps lower the possibility of receiving the "[ticker] Order rejected due to Margin order status" prompt message.
4.b. Available cash insufficient
There is another scenario that triggers the Margin order state. As the backtrader process displayed above, your orders are usually placed using for loop to loop through each symbol in the next or next_open stage. Yet, your orders placed only get executed when you reach the notify_order and notify_store stage. That is to say, your available cash won’t update while you place orders in your for loop. If your trading strategy requires you to optimize capital utilization by holding minimum cash, your available cash is very likely to be sufficient to place any buy order even if you try to release your cash by selling your holding stocks.
To make sure your strategy won’t have any glitches while placing buy and sell orders on the same day, you need to keep track of your available cash at all times.
5. Use hot data over cold data
In your trading script, you might need to load a huge pandas dataframe with a lot of columns and factors to support your algorithm. This huge amount of data costs you a lot of time to load into your backtrader script. From my point of view, I would rather complete many backtests as fast as possible. Therefore, I would keep a copy of my data and load it into the trading script as the hot data. In that case, you can save time while loading data into backtrader to be processed a second time.
These are the things that I found when transforming backtrader into a multiple-stock trading framework. Hope this helps you to build your backtesting tool. Cheers.


