
Photo by Sasun Bughdaryan on Unsplash
We’ve been talking too much about the attack side of quantitative trading, such as momentum, mean reversion, and ML. These strategies aim to outperform the benchmark/index by adding your personal points of view to the trading strategies. Beating the benchmark becomes the only goal when playing the offense. What about defense? After reading Introduction to CPPI – Constant Proportion Portfolio Insurance, I started to feel that I can’t agree more with the idea of “The best defense is a good offense” once said by Sun Tzu, a Chinese military general, a strategist, and a philosopher. What does defense mean in the field of quantitative trading? Does defense mean we strive not to lose money and then nothing else worth doing? Maybe talking about the CPPI strategy would give us a better picture of what actually defense means to the traders. Let’s now have a look at how to approach the other side of trading.
If you enjoy reading this and my other articles, feel free to join Medium membership program to read more about Quantitative Trading Strategy.
What does it mean by playing defense in trading?
When talking about quantitative strategy, they all come down to this advanced CAPM formula and use it to categorize different trading strategies. $\beta$ in this formula stands for the sensitivity of your portfolio against the movement of the market return and $\alpha$ stands for the excessive market return that can’t be captured by the $\beta$ term. For example, if the current risk-free rate is 1%, and the market return is 4% with 0 in $\alpha$, then you can calculate that your expected return would be $2*(4\%-1\%) + 1\% = 7\%$ if the $\beta$ equals to 2, or 10% if the $\beta$ equals 3.
Advanced CAPM model by Jensen
The $\beta$ here is essentially the exposure of our portfolio against market fluctuation. The idea of playing defense in trading is to reduce the exposure against the market so that you will lose less money than other people in the bear market. There are ways to reduce market exposure, such as market-neutral strategy, portfolio diversification, hedging, and many other methods that help reduce your market exposure and $\beta$ of your portfolio. However, reducing $\beta$ could also harm your profit when the overall market goes up because you have a smaller $\beta$. This is what happens when you play defense in trading.
What is CPPI (Constant Proportion Portfolio Insurance) strategy?
CPPI (Constant Proportion Portfolio Insurance) strategy achieves the goal of reducing risk exposure by adding a risk-free asset such as a 3-month treasury into your portfolio, which can be considered as a type of portfolio diversification. Short-term treasury usually has very little risk exposure against the market. You can see below the close price movement of SHV, SHY, TLT, and IEF compare to the movement of SPY close price.
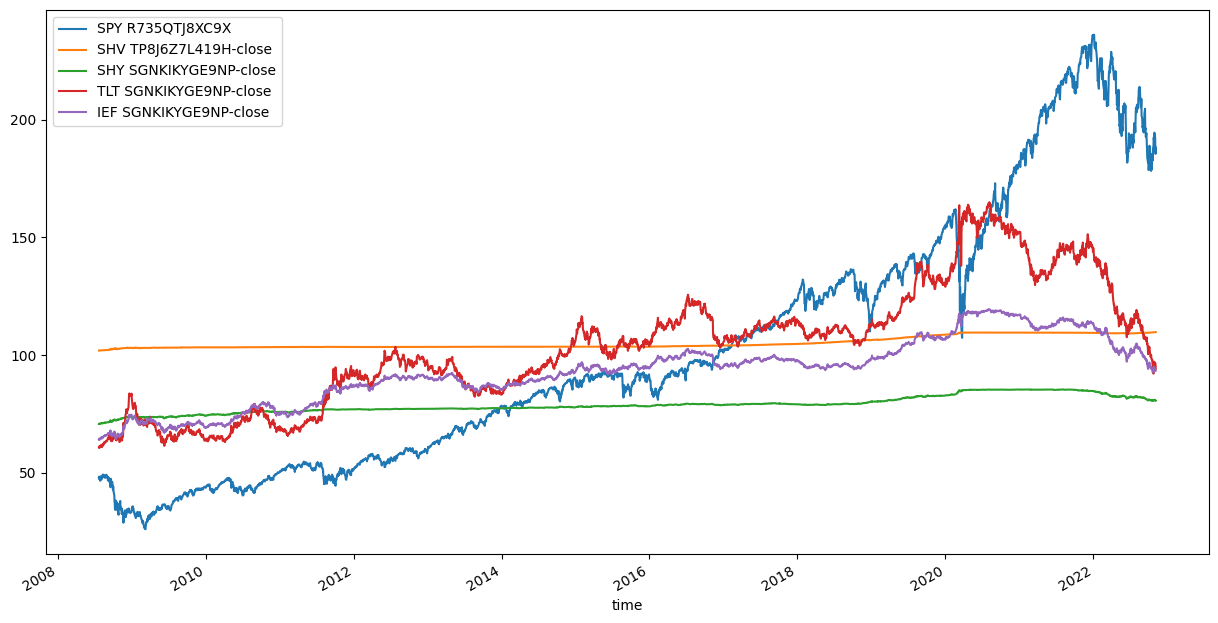
Which asset is worth being picked as a risk-free asset? As SHY and SHV are short-term Treasury ETFs, and TLT and IEF are long-term Treasury ETF
On top of adding a risk-free asset into the portfolio, the CPPI strategy proposes concepts named Floor and Cushion. Floor would be the minimum asset value that you want to protect from loss, and the Cushion is the asset value that you would like to invest in riskier assets in order to gain an additional return. CPPI strategy allows investors to keep the potential chances of profiting, and limiting the downside risk by scaling the ratios of the floor and cushion dynamically. I’m listing the related formulas below for reference. For more details, go take a look at the article in QuantPedia.
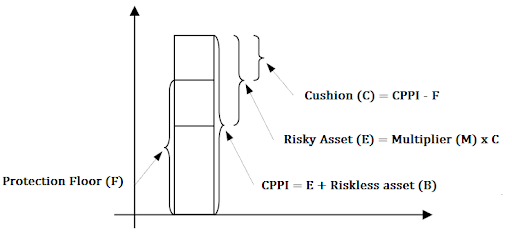
Extracted from Introduction to CPPI – Constant Proportion Portfolio Insurance
Disadvantages when applying CPPI strategies
After conducting a series of backtesting against the proposed strategies in the article, I’ve found the strategies are less promising and less satisfying than I originally expected. Here are a few things I discovered:
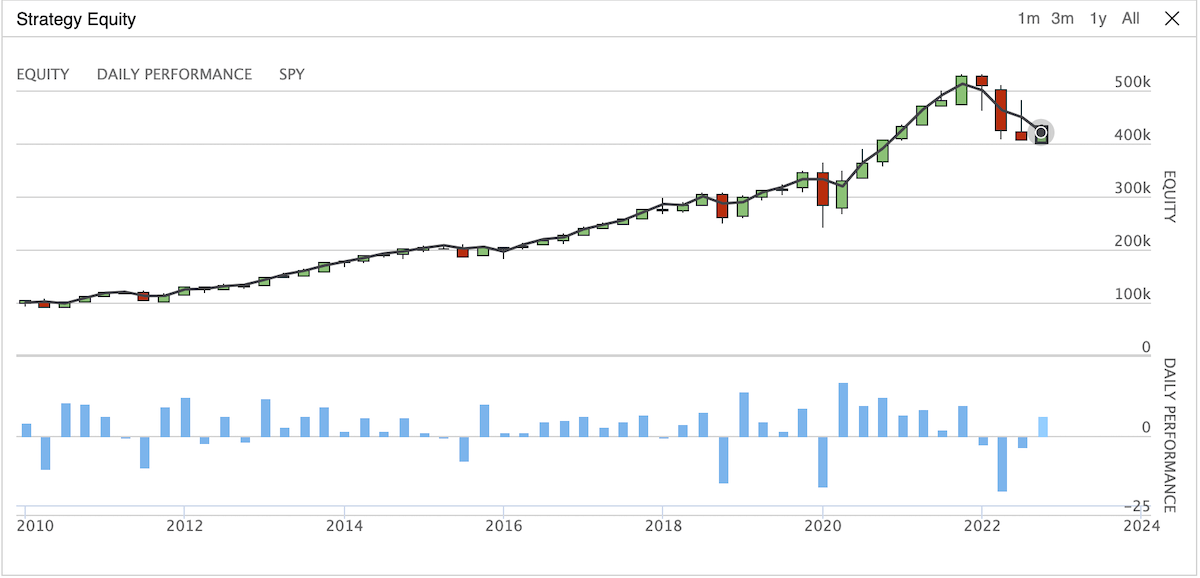
Floor level is fixed even if the total asset value go rocket high
- In Basic CPPI strategy: I approached this strategy by setting a fixed percentage (80%) of the original asset that I want to protect from the beginning. This means, for example, I have \$100,000 as my start-up fund, and I want to protect 80% value of my fund. Then I’ll have \$80,000 as my floor level.
- Even though we have the minimum asset value protected, the floor value stays the same throughout the entire backtesting period. This also means that there is a big chunk of the asset not protected when the portfolio grows a certain amount. That’s the reason why we suffer a huge drop at the beginning of 2022.
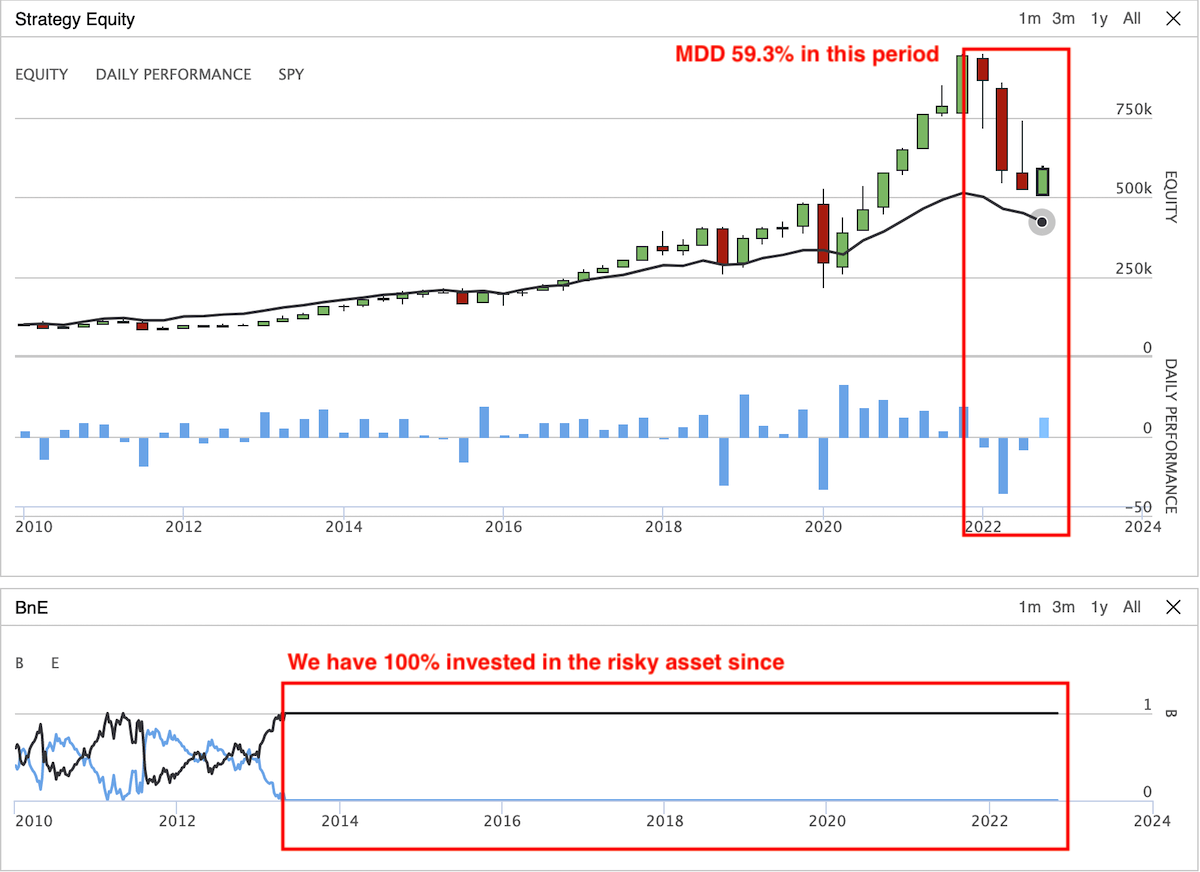
Basic CPPI: Max Drawdown: 59.3%, Annual Variance: 0.069
The value floor trench
- In New High CPPI Strategy: Applying New High CPPI strategy will update the floor when the total portfolio value reaches a new high and the floor value accordingly. Therefore, our increasingly growing floor will help us protect more value when there’s higher value in our portfolio.
- There’s one scenario that could cause this strategy less effective. When your portfolio value grows substantially, your floor value also increased along the way and reached a skyrocket-high number. What if one day the market crashed and the portfolio value dropped way below the floor value, you’ll then need to invest 100% of your asset into bonds/treasuries by the definition of the New High CPPI strategy. It’d take months or even years for the portfolio to recover to above the floor level. By looking at the backtesting result below, we miss the fantastic opportunity to grow our portfolio back to where it was and fall into a floor trench.
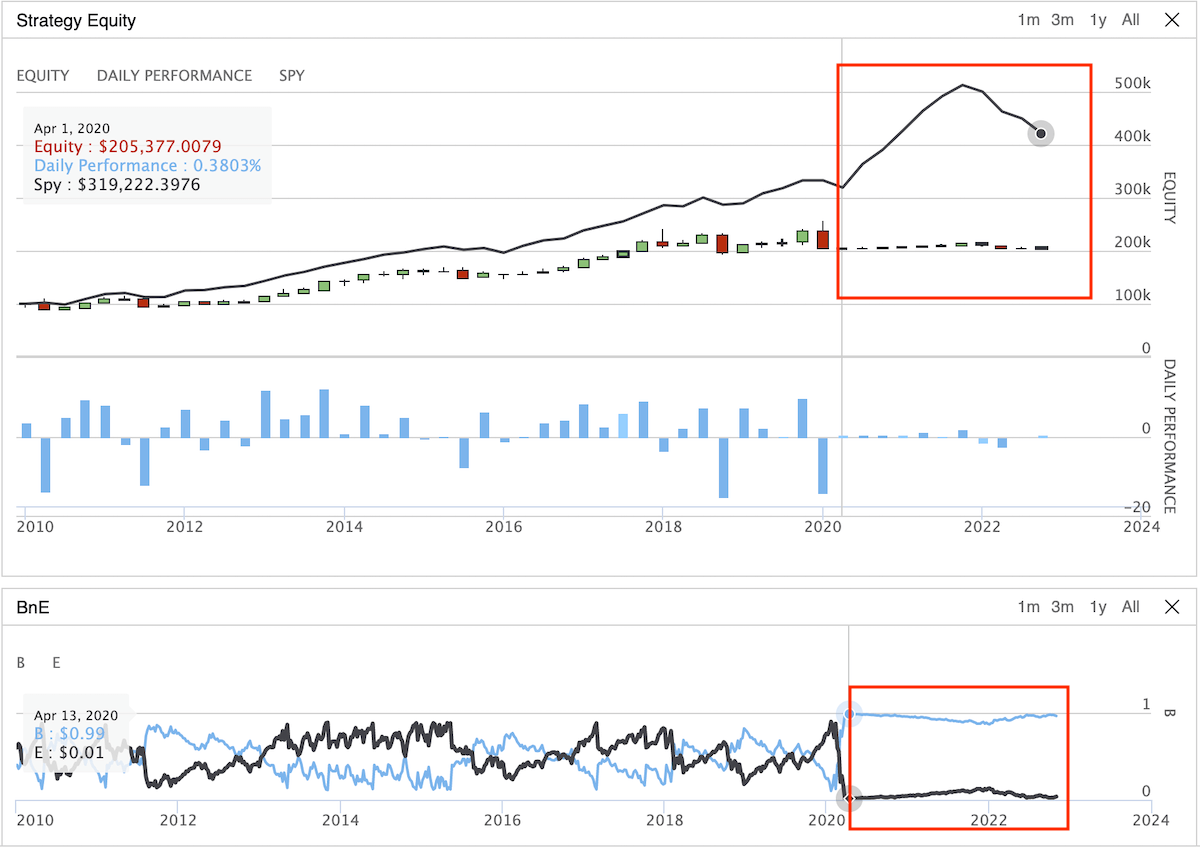
New High CPPI ex1: Invest nearly 100% in bonds/treasuries after 2020
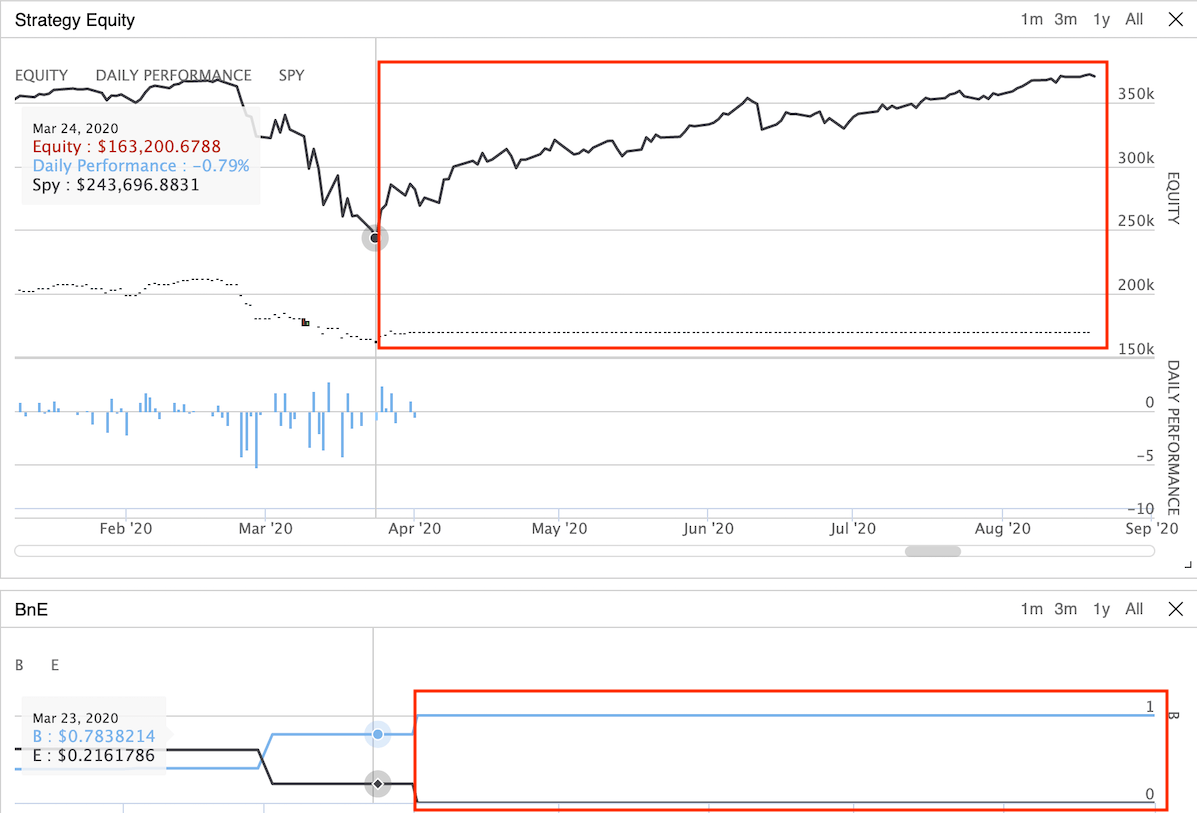
New High CPPI ex2: Investment loss will take a long time to recover back to floor level
Let’s add some spices to make the strategy promising
Since now we know the basics and pros and cons of the CPPI strategy, let’s add some spice to this strategy to make it more appealing so that traders like you will be more than willing to invest.
Change the meat
As we all know the CPPI strategy can preserve the upward potential and limit the downward loss to a certain degree, why don’t we use the 2x SPY ETF to replace the SPY ETF to gain more upward space? Therefore,
- Risky asset
- We use
SSOwhich is a2x SPYETF so that we can exploit the high upward growth possibility.
- We use
- Risk-free asset
- We use
SHVas it seems to be the more stable among the four risk-free assets we mentioned earlier in this post.
- We use
- Benchmark
- We still use
SPYto be our benchmark
- We still use
Add seasoning
As proposed in the article Introduction to CPPI – Constant Proportion Portfolio Insurance, we can apply the dynamic multiplier method so that we get to use different multipliers depending on the market volatility instead of picking a fixed number throughout the backtesting period.
- Fixed multiplier
- We make the multiplier equal to 3 at all times.
- Dynamic multiplier
- We set a few indicators to categorize the regimes of current market volatility
- $EMA_{21d}$: Exponential moving average of close price in past 21 days
- $SMA_{63d}$: Simple moving average of close price in the past 63 days
- $\overline{EMA{21d}}$: 126 days average of $EMA{21d}$
- $\overline{SMA{63d}}$: 126 days average of $SMA{63d}$
- We set a few indicators to categorize the regimes of current market volatility
Additional flavor: Smart Floor
An idea struck me when I was working on backtesting the scenarios from the article: what if we can build a somewhat flexible/intelligent mechanism that can adjust the floor level based on historic values? The whole process of calculating the floor value has reminded me the process of using Gradient Descent to approach the local optima. If you are not familiar with the idea of Gradient Descent, check this video out, and it will give you a general idea of what it is and what it is for.
Gradient Descent, Step-by-Step by StatQuest
Therefore by borrowing the main idea from the Gradient Descent, we can update our floor value based on the difference between the current total asset value and the total asset value from the previous period. We multiply this difference with the learning rate $\alpha$ and add it to the previous total asset value. Then the base value used for calculating the floor level is now one step closer to the current total asset value. Here’s what the formula looks like:
To mitigate the impact of trading fee charges, you can also add a buffer when updating the Base Value to make sure you don’t update it too frequently, causing unnecessary loss on the trading fee.
Backtesting and result
Now we have three ways to update our floor value: basic floor, new high floor, smart floor, and two ways to decide our multiplier: fixed multiplier and dynamic multiplier. Including the buy and hold strategy as the benchmark, let’s mashup these conditions and start conducting backtest against each of the scenarios.
Platform
Universe
- Using
SPYas the portfolio benchmark SHVas risk-free assetSSOas the risky asset
Rebalancing strategy
We update the CPPI and floor value every week, and then we adjust the proportion of risky and risk-free assets accordingly.
Backtest time frame
Three time periods we’re going to test against with:
- Full period: 2010, 1, 1 - 2022, 11, 1
- To backtest the complete period and evaluate the overall performance
- Bear market period: 2007, 1, 1 - 2012, 1, 1
- To backtest the bear market scenario and evaluate accordingly
- Bull market period: 2015, 1, 1 - 2019, 1, 1
- To backtest the slow bull market and evaluate its performance
Benchmark backtest full period: 2010/01/01 - 2022/11/01
Execution and backtest
Here we go!
Scenarios
We’re going to run the following backtest scenarios against three time periods:
- SPY, Buy-and-hold
- SSO, Buy-and-hold
- SSO, Basic floor, Fixed Multiplier
- SSO, Basic floor, Dynamic Multiplier
- SSO, Newhigh floor, Fixed Multiplier
- SSO, Newhigh floor, Dynamic Multiplier
- SSO, Learning floor, Fixed Multiplier
- SSO, Learning floor, Dynamic Multiplier
Backtesting results
Full period
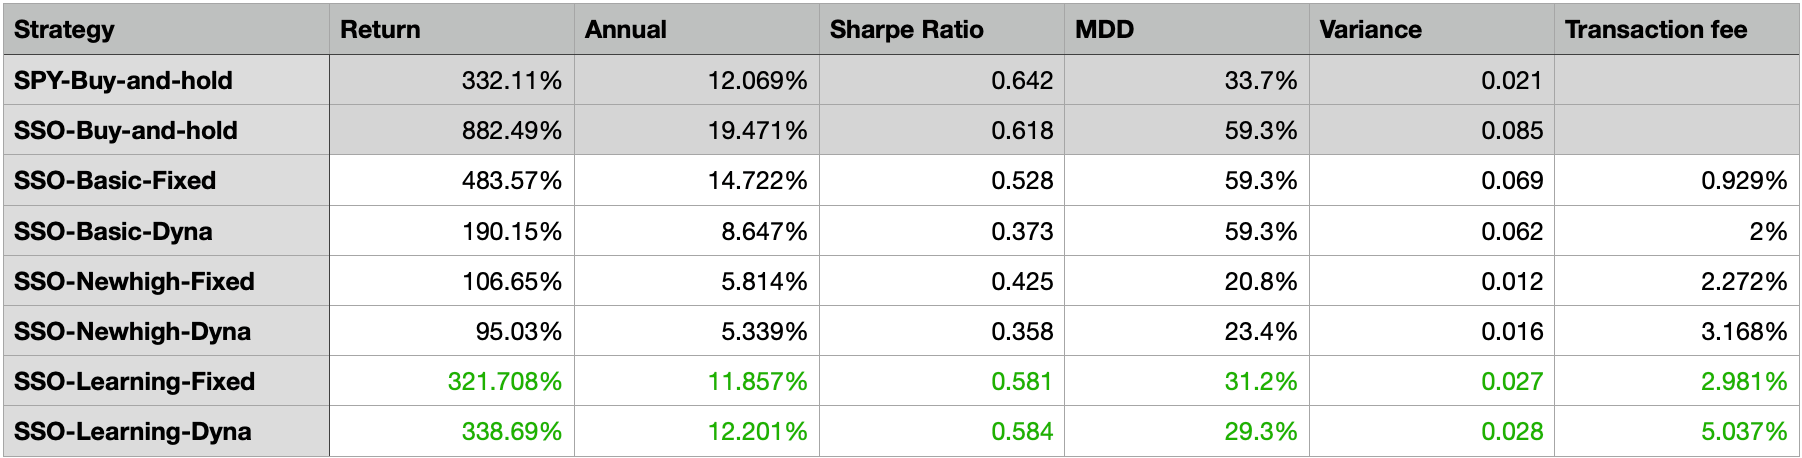
Backtest full period: 2010/01/01 - 2022/11/01
The backtest results on the right-hand side have the highest max drawdown 59.3% among all scenarios. We can see that the scenarios SSO, Learning floor, Fixed Multiplier and SSO, Learning floor, Dynamic Multiplier both have similar annual returns as the SPY benchmark scenario, but have lower and better MMD and variance. At the first glance, the Smart (learning) floor seems to have a great capability to keep to upward potential and limit the downward risks. Now let’s look at the other two scenarios.
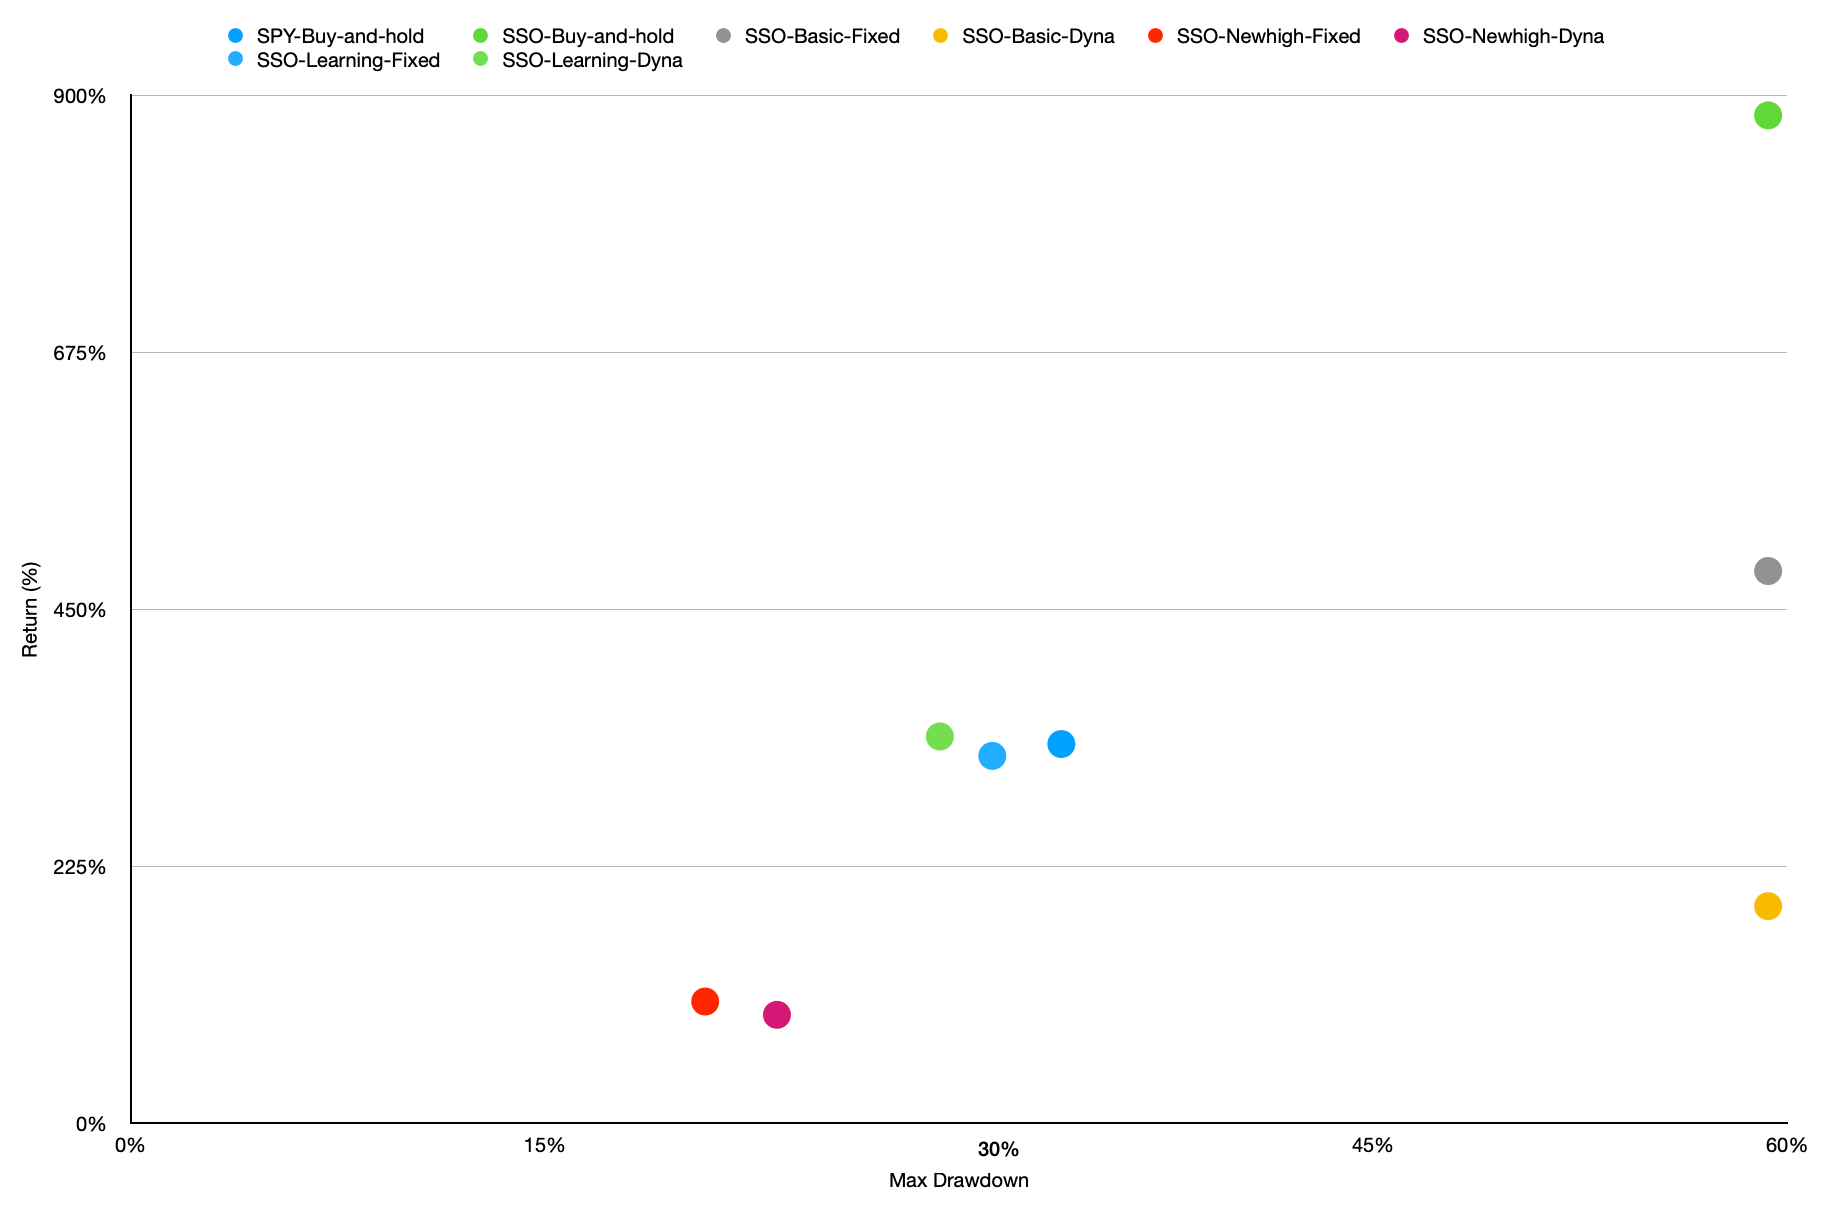
Scatter chart of full period: 2010/01/01 - 2022/11/01
Bear market period
Backtest bear period: 2007/01/01 - 2012/01/01
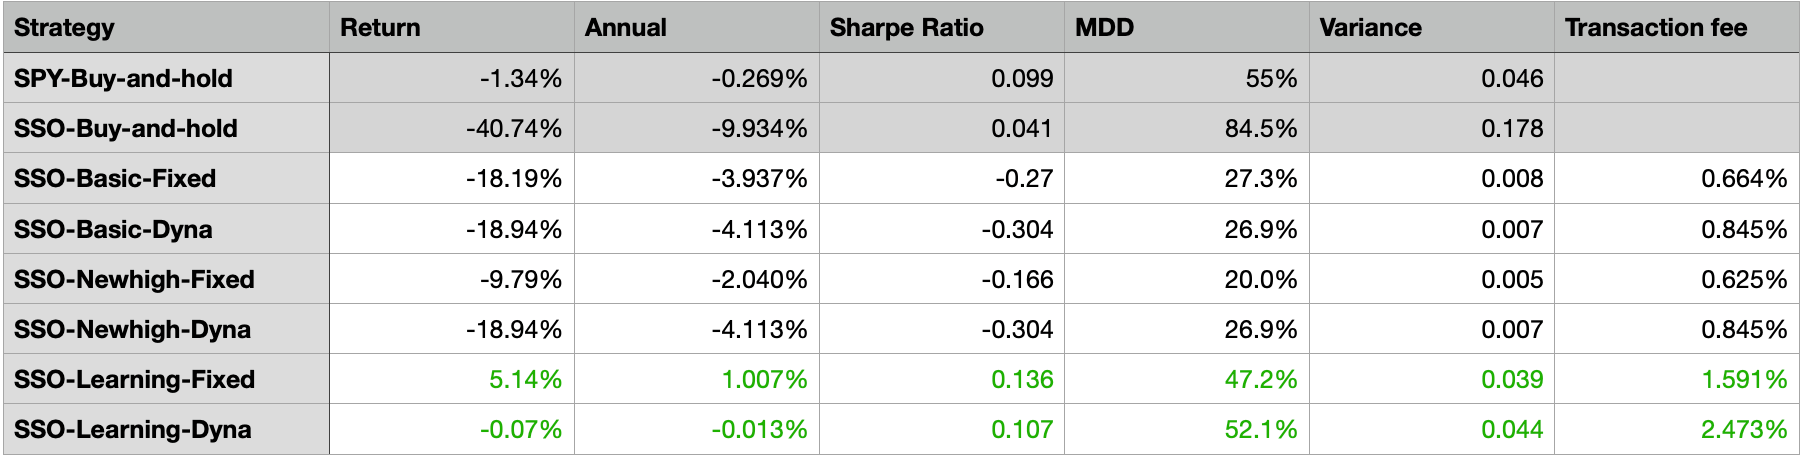
It’s very obvious that the scenario SSO, Learning floor, Fixed Multiplier and SSO, Learning floor, Dynamic Multiplier has the highest returns among all the backtests including the benchmark buy-and-hold backtest. The Sharpe ratio, MDD, and annual variance of these two scenarios are also improved compared to the benchmark scenario. Seems CPPI with learning floor does have the capability to limit the downward loss.
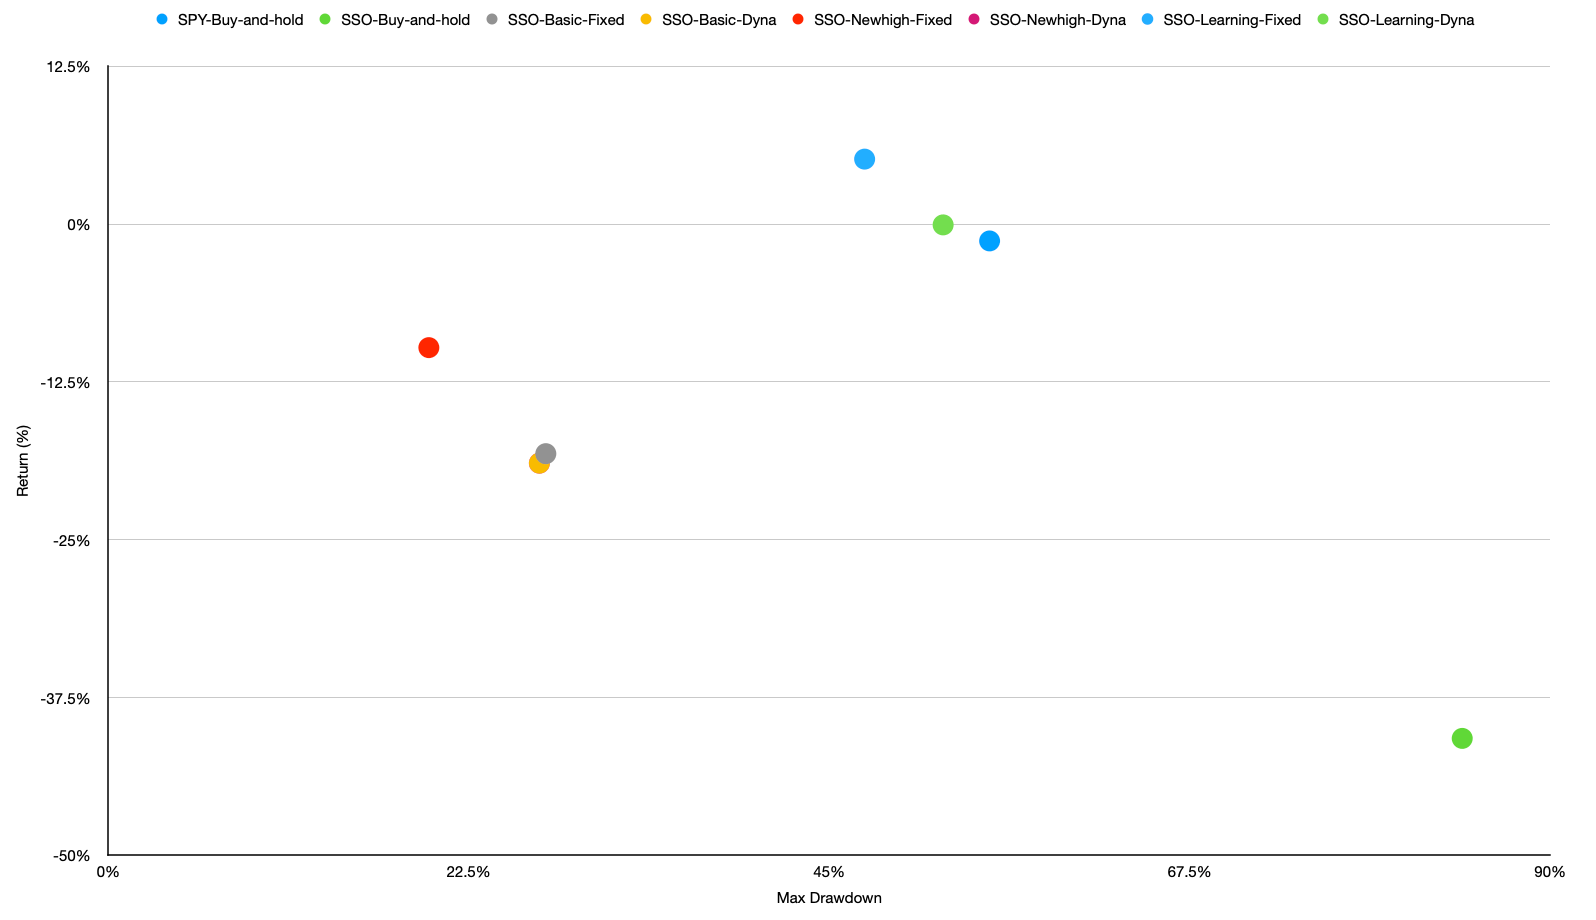
Scatter chart of bear period: 2007/01/01 - 2012/01/01
Bull market period
Backtest bull period: 2015/01/01 - 2019/01/01
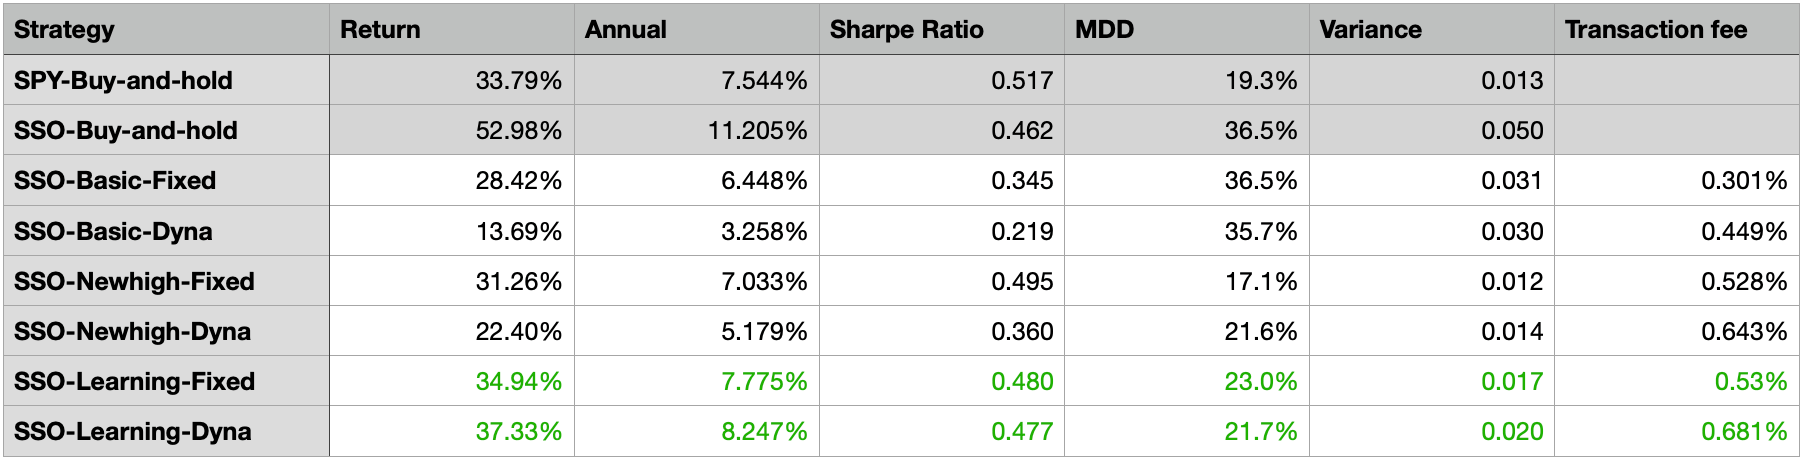
The distribution of the backtests looks similar to the full-time period chart. The three right-most scenarios SSO-buy-and-hold, SSO-basic-fixed, and SSO-basic-dynamic have the highest MDD, which is the outcome that we’re trying to avoid from the beginning. In the meantime, the scenario SSO, Learning floor, Fixed Multiplier and SSO, Learning floor, Dynamic Multiplier still outperform the other scenarios in terms of overall returns and MDD.
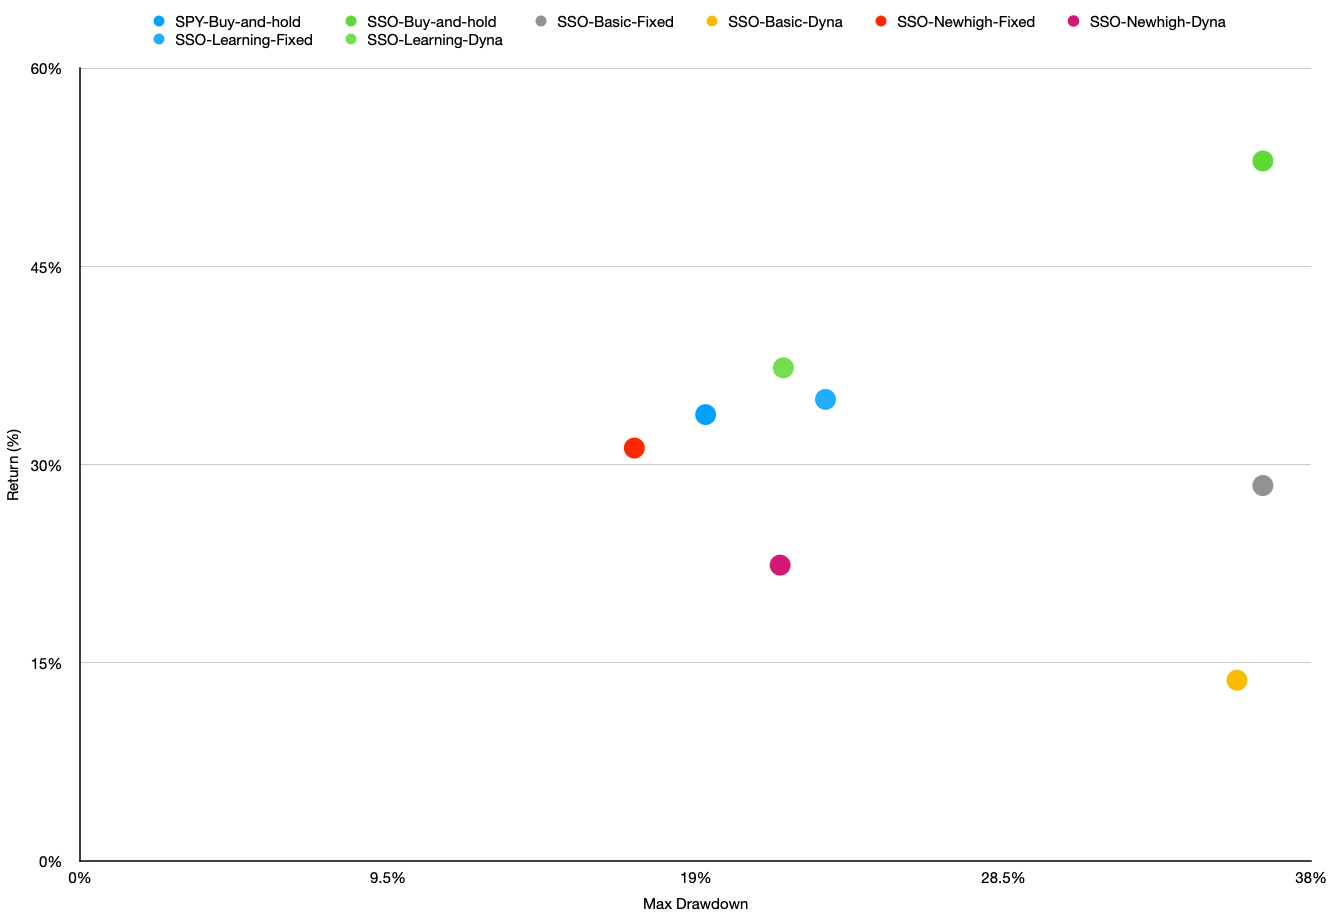
Scatter chart of bull period: 2015/01/01 - 2019/01/01
Conclusion
Here’s my report card of my winning candidate strategy: SSO, learning floor, fixed multiplier: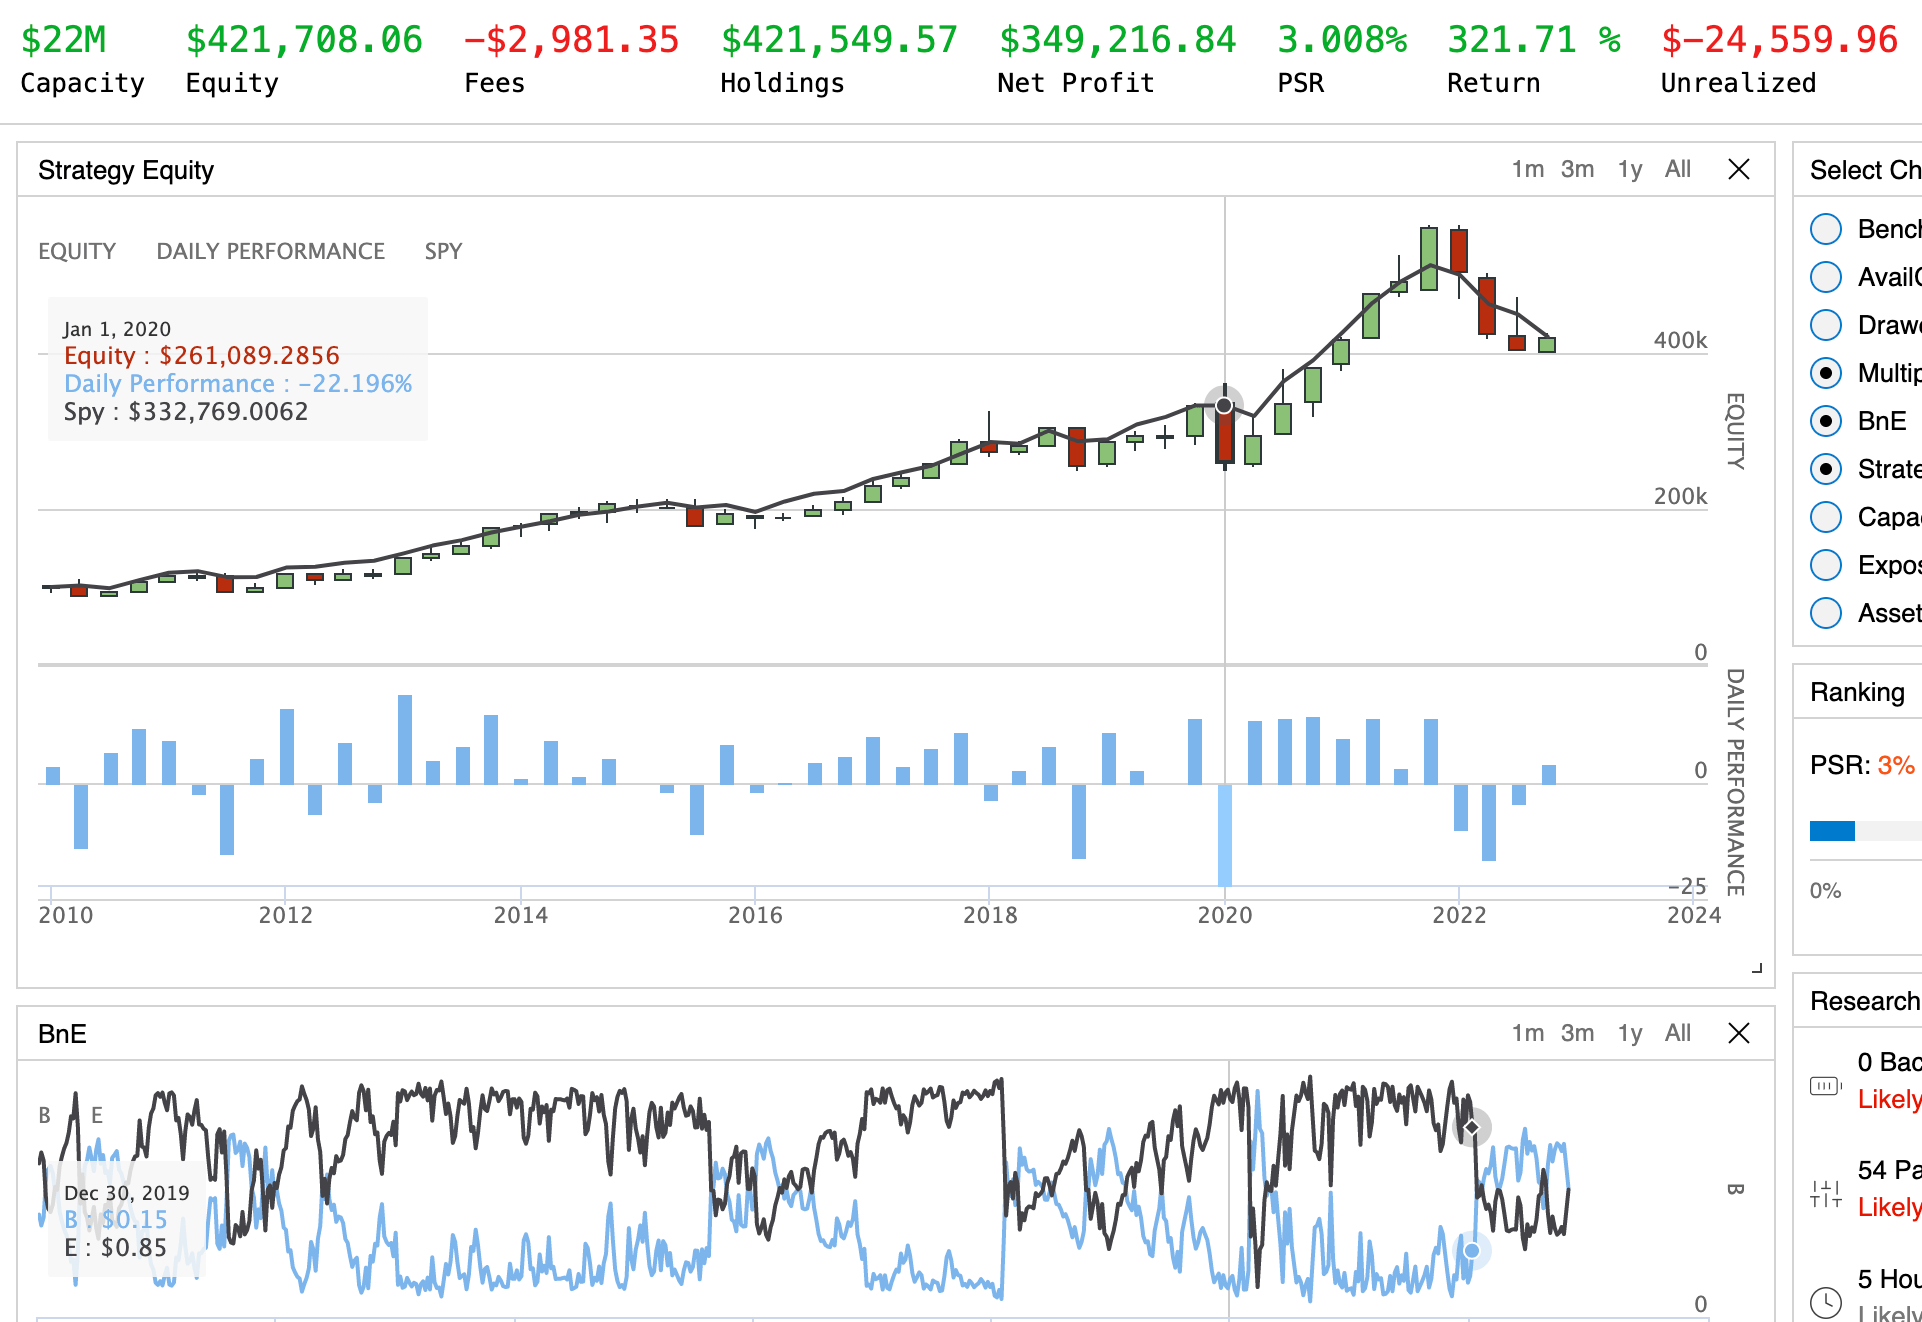
SSO; Smart Floor; Fixed multiplier
It seems that all the scenarios are able to limit their downside risk due to the fact that we added risk-free assets into our portfolio, achieving the goal to diversify the risk. Even though the returns are diluted, some of the scenarios still show promising outcomes by keeping proportional profit in the book (especially the scenarios using Smart Floor). As for the impact of whether adopting either dynamic multiplier or fixed multiplier is not yet significant, there would be more research needed to make a statistical decision on which method works better than the other.
Misc
Reference
- Introduction to CPPI – Constant Proportion Portfolio Insurance
- MBA Lib: Constant Proportion Portfolio Insurance Strategy
- Portfolio insurance strategies in a low interest rate environment: A simulation based study
- If you can’t beat the market at least you can protect from it using Python


