
Grid trading strategy is famous for its simplicity and ease of execution, and you don’t even have to guess where the market is going. No technical analysis and indicators are needed or recognize any patterns among endless candlesticks. It was once known as the ‘no-loss strategy’.
But, is this true that there is a strategy that causes you no risk?
Today we’re going to look at what grid trading strategy is about, and we will conduct a series of backtesting against the Forex market to see whether it is the holy grail of our trading strategies.
Talking
Forex (FX) and Forex trading
Forex (FX) is short for Foreign Exchange, which is the global electronic marketplace for proprietary institutions or public companies/individuals to trade international currencies and currency derivatives. Prior to the Internet age, trading in the forex market is exclusive to large financial institutions, corporations, central banks, hedge funds, and extremely wealthy individuals as the information isn’t public and timely enough for the rest of the people. Once the internet emerged, the availability of the information empowers any individual to trade the foreign currency at a fair price whenever they need to. For example, if you’re living in the UK and you would like to buy a piece of furniture from the states, you want the furniture to be received in China and then pay the money to the US dealers. Hence, you need to convert your GBP to USD on the Forex market so that you can pay USD to the US dealers.

Ill. I. International tradings require foreign currency exchange
There are a few things that the Forex market differs from the stock markets:
- Forex opens 24/7, therefore the exchange rate changes even during weekends.
- The Forex brokerages open only within a specific timeframe, meaning your investment could variate drastically and you cannot do anything about it if you own the overnight positions.
- The currencies traded on the market in pairs, such as EUR/USD, AUD/JPY, GBP/CAD, …. For example, EUR/USD’s current quote is at 1.0791, meaning you would be able to buy 1 Euro with 1.0791 USD.
- As the Forex rate volatility is relatively way smaller than the equity stocks, most of the Forex agencies provide a leveraged account that allows you to play leveraged trade in the Forex market.
As the example illustrated above, there will be people or institutions who demand specific currencies to fulfill their personal or business needs. Therefore, as an individual investor, you are able to offer your capital there with an exchange rate $r{Today}$ for anyone who needs your capital. By the time you need your capital back into your pocket, you then go to the market and recall your investment with the exchange rate $r{Later}$. What’s in for you? When the invested currency goes higher, you will be able to earn the difference between $r{Today}$ and $r{Later}$ while converting that currency back to the currency you own. The loss would also incur if the exchange rate goes in the opposite direction.
That being said, trading foreign exchange is actually pretty similar to trading equity in the stock market. You always try to buy low and sell high.
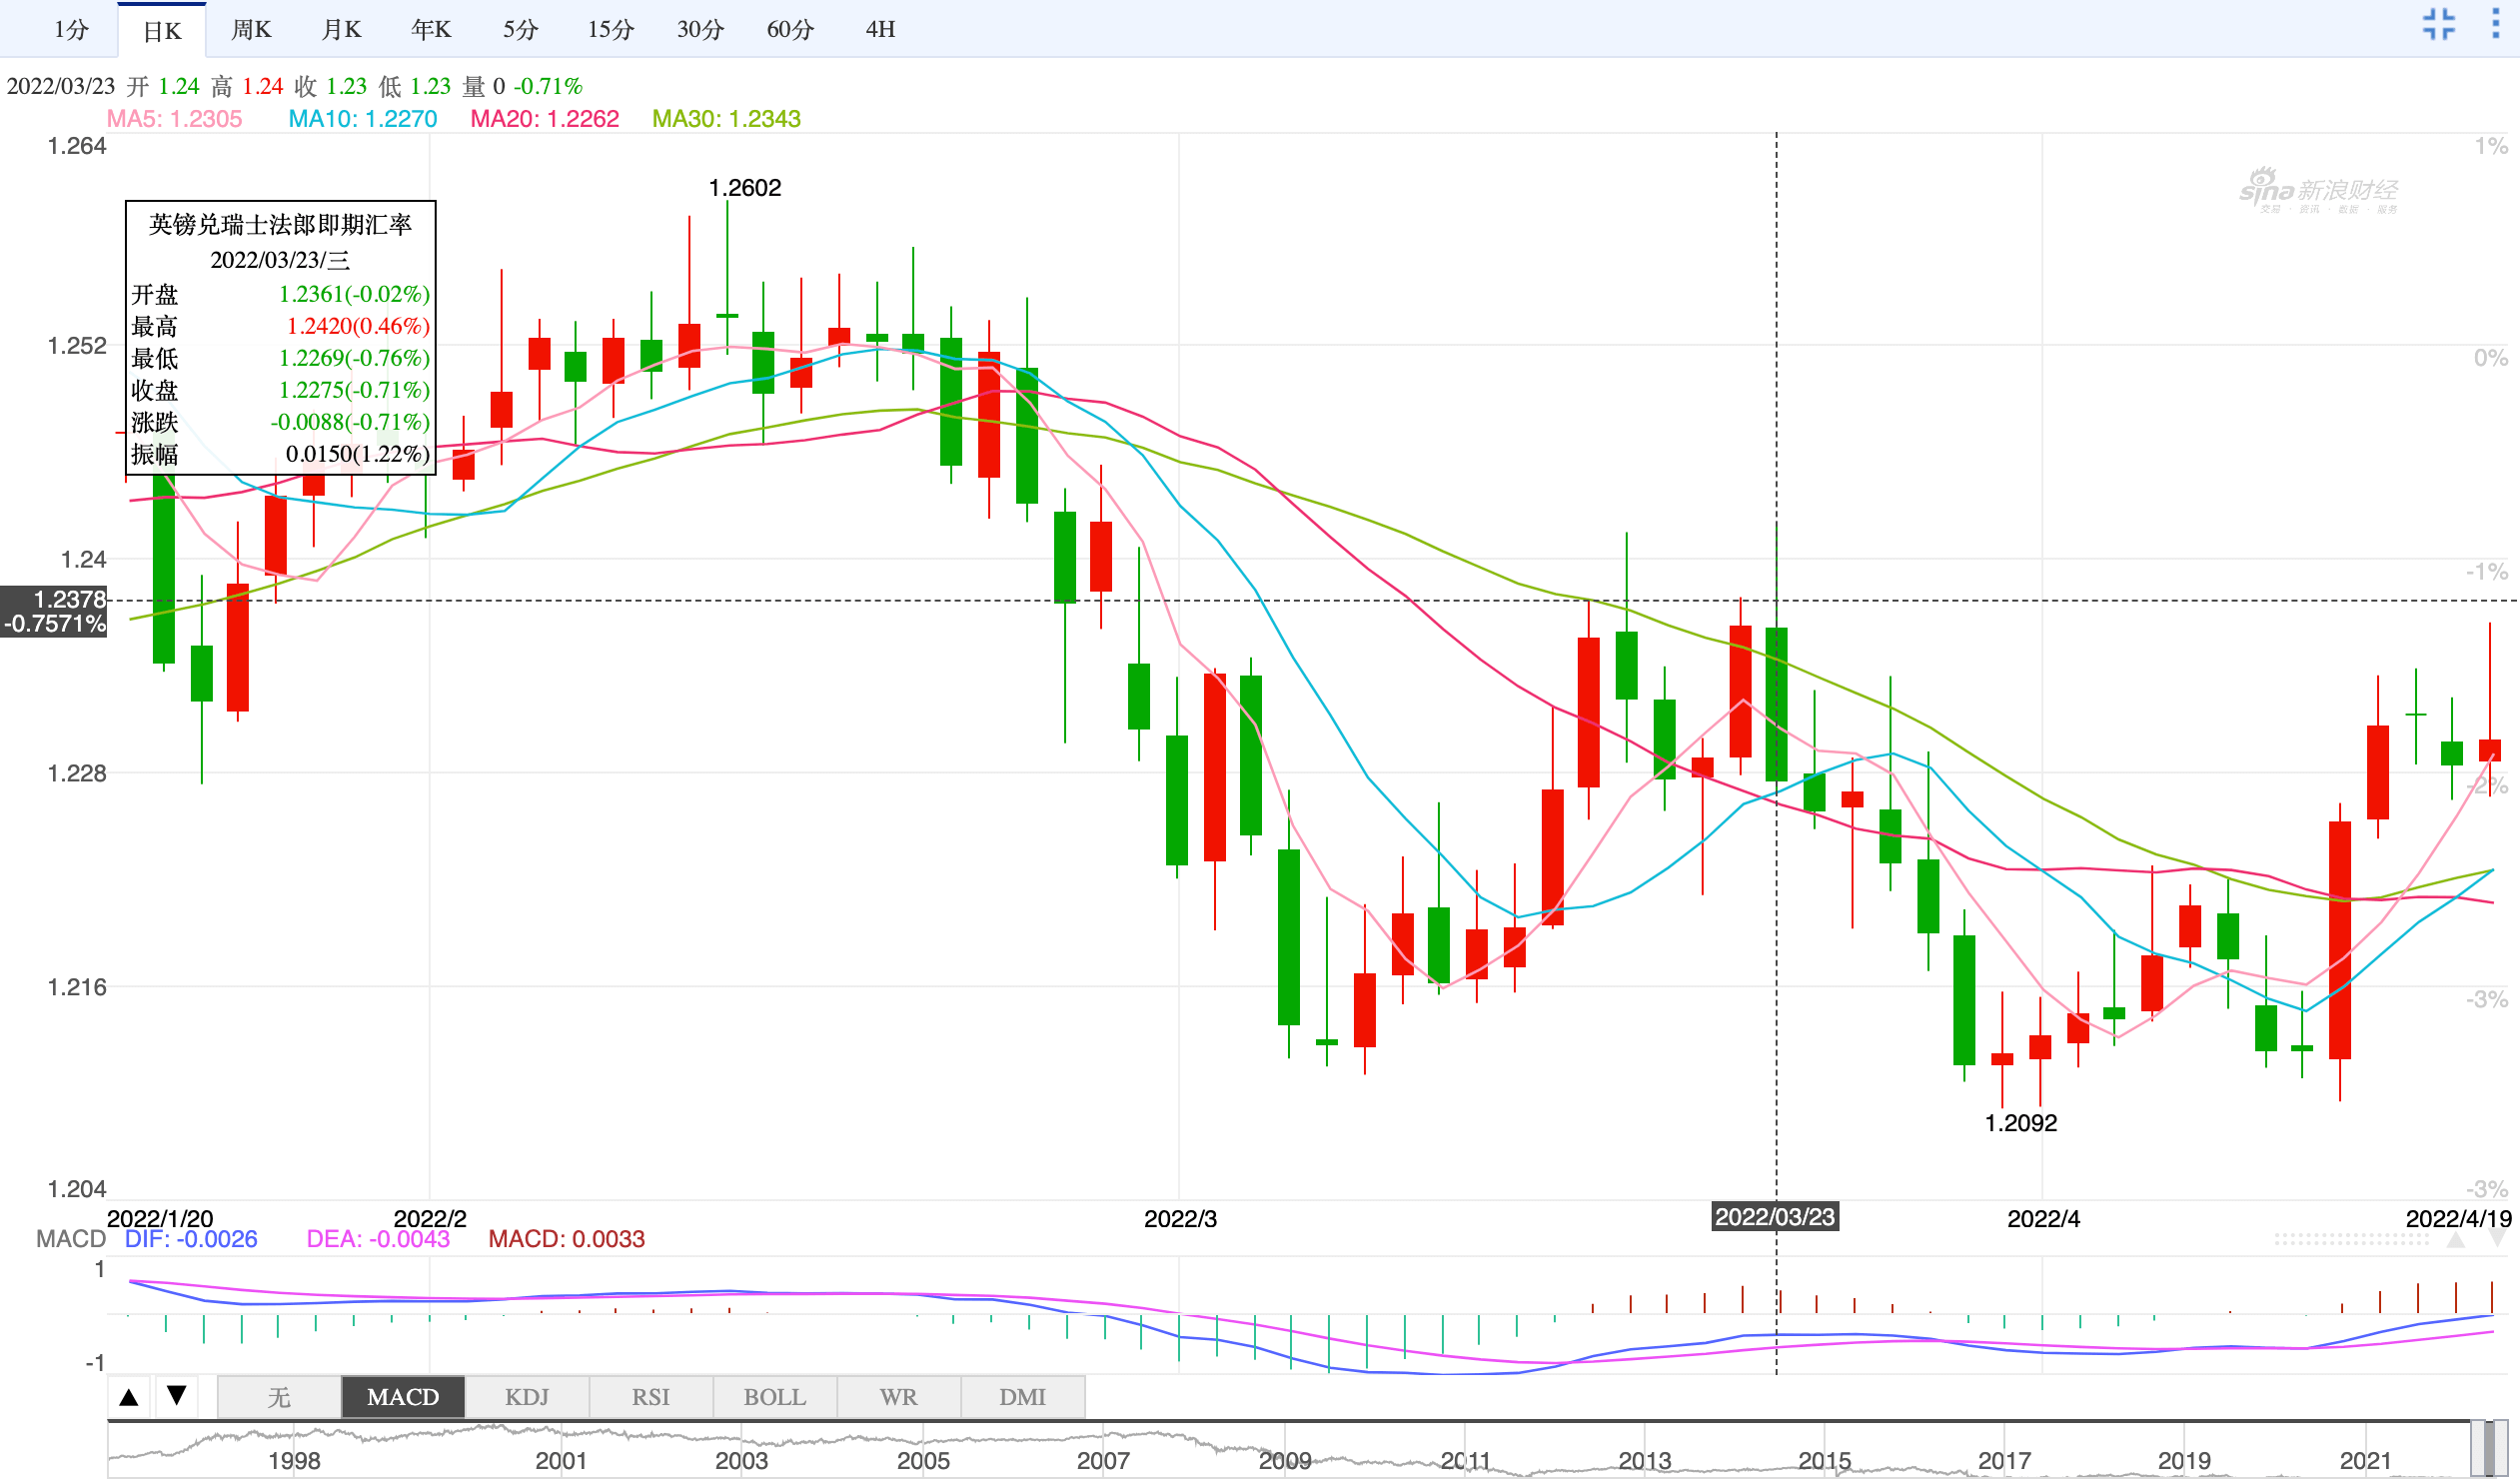
Ill. II. The historical candlesticks diagram of GBP/CHF
Forex grid trading strategy
The grid trading system’s central idea is to build a “price grid” around the reference quote price, usually yesterday’s close price, and buy (long/short) when the price trigger one of the bars in your grid and closes the position when you have gained a small piece of the profit. You trade like that when the price moves up and down over and over again. In the end, you’ll be able to accumulate small pieces into a big chunk of profit. This essentially is an extended version of the “mean-reversion trading strategy”. Quantpedia has a very nice piece to articulate what a grid trading system is about here.
Let’s visualize the grid trading system so that it’s easier to understand:
Ill. III. The grid trading system
The above trading system deploys three bars above the reference price and three below. Each bar has the same distance from the other. If the price first goes bearish and hit the bottom of the day, by that time we will have already three long positions purchased at prices b1, b2, and b3. Once the market starts reversing and the price goes above the reference price bar, three orders will be sold at prices s1, s2, and s3 respectively. In this case, you will make $\text{(s1-b1) + (s2-b2) + (s3-b3)}$ as your total return.
The uptrend continues, you’ll build another three short positions b’1, b’2, and b’3 when the price reaches today’s high. These three positions will be closed when the price drop below the reference price.
I believe you now get the idea. The two essential ideas of this trading strategy are:
- The more fluctuation in price, the more we profit.
- The average price should stay relatively stable without soaring or plummeting too fast.
The below chart is extracted from one of my backtest, and it perfectly illustrates what kind of trend we’re looking for to profit from implementing the grid trading strategy.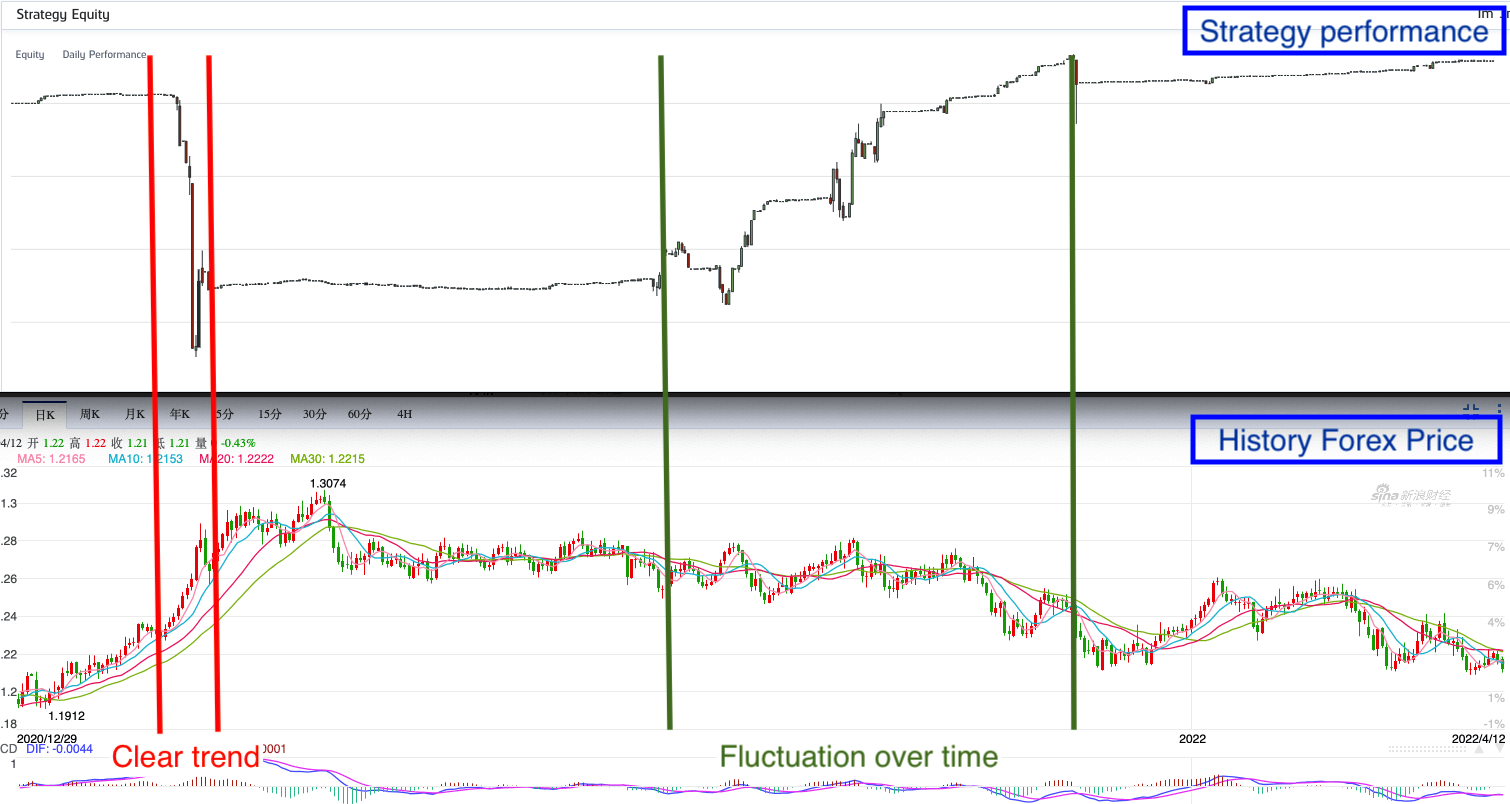
Ill. IV. The grid trading system
Most people believe the foreign exchange market is the best place that fit the two conditions we describe above. That’s why we’re going to backtest the grid trading strategy using Forex. Also, since the rules are relatively clear and simple, that makes the grid trading strategy is the best candidate to run/trade automatically with several of the conditions in place beforehand.
Doing
Strategy implementation
Strategy setups for our backtests
Let’s first start with identifying the parameters we need in this strategy:
- Reference price
- We use the close price before the previous market closed.
- Grid number
- 10 bars above the reference price bar, and 10 bars below the reference price bar
- Grid range
- Grid range indicates the price range that we’re monitoring. We deploy the 20 bars across this price range. Therefore, setting a proper range would be critical to the system. If you have a pretty wide gap between bars, you’ll get fewer triggers when the price moves. On the contrary, if you have a fairly narrow gap, the price could easily penetrate your grid range and never fall back to where it was, causing a huge cost to your portfolio.
- Here we use 2 times the standard deviation of the close price in the past three months as our grid range.
- Leverage ratio
- Most of the Forex brokerages offer N leveraged accounts, meaning you’ll be able to deposit 1 dollar in your account and invest 1 N dollars in the Forex market. For example, Oanda offers 100x leveraged account type to premium customers. In this example, let’s set it to 50x for now.
- Position allocation
- We have set up two different methods to allocate your assets in each bar:
- Average: We allocate the same amount of capital to each order on every bar.
- Double down: As the current quote price goes further away from the reference price, we double down the amount of the position in each order. Let’s take Ill. III. The grid trading system for example, in limit order b1 and b’1, we placed 1 hand, in b2 and b’2 we place 2 hands, and in b3 and b’3 we place 4 hands. [1, 2, 4, 8, 16, ….]
- We have set up two different methods to allocate your assets in each bar:
Platform
Universe
I’m not going to use the concept of the universe in the backtesting of this strategy. Instead, I’m going to backtest the following foreign currency pair to see which currency pair best fits the nature of the grid trading strategy.
- GBP/CHF
- AUD/CAD
- GBP/CAD
- USD/JPY
- AUD/JPY
- EUR/GBP
- GBP/USD
Backtest time frame
Backtest Date: 2021, 1 ,1 ~ 2022, 4, 16
Signal generation
The triggering signal is very straightforward. As I mentioned in the Forex grid trading strategy section, the long/short limit order will be automatically triggered when the current close price touches the grid bar. However, in order to simplify the logic and to make everything automated so that the order can be generated in a timely manner, I’ve added my own tweaks to this grid trading system.
Referring to chart in Ill. III. The grid trading system, we see [b1, s1], [b2, s2], …, [b’1, s’1], [b’2, s’2], … as order pair. The first one in the pair is the long/short limit orders that we will place before the market starts. As long as any of the limit orders is fulfilled, the second one in the pair will be automatically triggered and generate another limit order waiting to close that position in order to gain profit. Vice versa, the fulfillment of the second limit order in the pair will also trigger the system to generate another open limit order waiting to catch the next opportunity. By doing this, we just need to set up 10 pairs of these on the long side and 10 pairs of these on the short side. See the following image for a quick illustration.
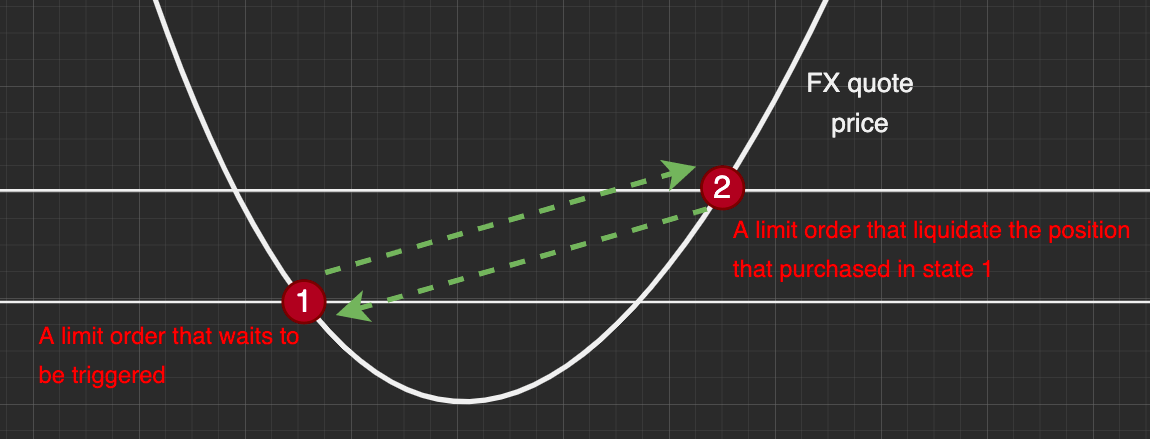
Ill. V. The grid trading system - system detail
On the monthly basis, we will create 20 pairs of these to catch any movement. By the end of the month, we cancel all these open orders and close all the positions we hold. Then the next day before the market open, we readjust our reference price and recalculate the standard deviation of the past 90 days again as our grid range. By doing this, we’re going to make sure the current price won’t drift too far away from our grid if there’s a bull or bear market in the currency we’re trading against.
Stop-loss control is also a crucial part to be installed in every trading system. I’m placing three different scenarios of stop loss to see how they work out:
- Don’t stop loss at all:
Let the profit fly. We don’t set up any stop-loss point. - Normal top loss: We monitor the distance between the current price and the reference price. If the current price deviates away from the reference price by over 20%, then we can reckon that there’s either an uptrend or downtrend that happens, which could cause a huge loss to our portfolio. If this happens, we liquidate all holding positions and close the rest of the opening limit orders. We’re not going to do any trade that month.
- Stop loss and rescale: In this scenario, right after we liquidate all existing positions and cancel open orders, we readjust all the parameters, including reference price and grid range, and deploy the grid again using the updated parameters instead of ceasing all the trading activities. We hope doing this would help us capture the new opportunities as soon as possible after the momentum of price rising/dropping ends.
Backtest result
| Currency | Level_method | Vol_method | Stop_loss | Rescale | Return | PSR | MDD | Total_trades | Sharpe_ratio | Win_rate |
|---|---|---|---|---|---|---|---|---|---|---|
| GBPCHF | average | STD | FALSE | FALSE | 83.33% | 42.549% | 80% | 1446 | 1.264 | 74% |
| GBPCHF | average | STD | TRUE | FALSE | 18.68% | 22.167% | 72% | 1104 | 0.478 | 72% |
| GBPCHF | average | STD | TRUE | TRUE | -6.34% | 13.999% | 74.3% | 1531 | 0.218 | 71% |
| GBPCHF | average | ATR | FALSE | FALSE | -76.1% | 24.781% | 99.5% | 5574 | 0.856 | 71% |
| GBPCHF | average | ATR | TRUE | FALSE | -16.05% | 6.052% | 39.7% | 2087 | -0.129 | 71% |
| GBPCHF | average | ATR | TRUE | TRUE | -91.48% | 0.027% | 94.2% | 8288 | -0.928 | 70% |
| GBPCHF | double | STD | FALSE | FALSE | 11.72% | 24.113% | 70.4% | 1442 | 0.587 | 97% |
| GBPCHF | double | STD | TRUE | FALSE | -24.58% | 0.686% | 35% | 1104 | -0.635 | 98% |
| GBPCHF | double | STD | TRUE | TRUE | -33.25% | 0.323% | 43.1% | 1531 | -0.763 | 97% |
| GBPCHF | double | ATR | FALSE | FALSE | -61.84% | 19.401% | 98.6% | 5573 | 0.477 | 94% |
| GBPCHF | double | ATR | TRUE | FALSE | 11.68% | 19.159% | 21.1% | 2087 | 0.38 | 96% |
| GBPCHF | double | ATR | TRUE | TRUE | -62.32% | 0.883% | 96% | 8288 | -0.755 | 96% |
| AUDCAD | average | STD | FALSE | FALSE | 16.9% | 21.526% | 42.4% | 959 | 0.473 | 66% |
| AUDCAD | average | STD | TRUE | FALSE | -24.29% | 5.07% | 49.1% | 814 | -0.187 | 68% |
| AUDCAD | average | STD | TRUE | TRUE | -24.44% | 5.904% | 56.2% | 1056 | -0.138 | 69% |
| AUDCAD | average | ATR | FALSE | FALSE | -41.20% | 10.311% | 74.3% | 4368 | 0.074 | 73% |
| AUDCAD | average | ATR | TRUE | FALSE | -40.6% | 0.005% | 43.2% | 1467 | -1.261 | 69% |
| AUDCAD | average | ATR | TRUE | TRUE | -78.65% | 0.041% | 88.9% | 8324 | -1.105 | 71% |
| AUDCAD | double | STD | FALSE | FALSE | 41.58% | 32.301% | 34.1% | 959 | 0.764 | 98% |
| AUDCAD | double | STD | TRUE | FALSE | -4.95% | 8.28% | 21.7% | 814 | -0.017 | 98% |
| AUDCAD | double | STD | TRUE | TRUE | -8.17% | 6.912% | 32.1% | 1096 | -0.082 | 98% |
| AUDCAD | double | ATR | FALSE | FALSE | 35.42% | 28.118% | 67.7% | 4368 | 0.704 | 96% |
| AUDCAD | double | ATR | TRUE | FALSE | -21.32% | 0.265% | 28.5% | 1467 | -0.934 | 98% |
| AUDCAD | double | ATR | TRUE | TRUE | -49.27% | 0.509% | 65.8% | 8324 | -0.931 | 97% |
| GBPCAD | average | STD | FALSE | FALSE | 97.54% | 49.78% | 43.5% | 1250 | 1.278 | 74% |
| GBPCAD | average | STD | TRUE | FALSE | 109.54% | 65.971% | 19.7% | 1203 | 1.661 | 75% |
| GBPCAD | average | STD | TRUE | TRUE | 156% | 78.098% | 24.1% | 1382 | 2.131 | 75% |
| GBPCAD | average | ATR | FALSE | FALSE | 137.75% | 49.858% | 52.5% | 5632 | 1.473 | 73% |
| GBPCAD | average | ATR | TRUE | FALSE | -17.27% | 2.41%% | 30.2% | 1913 | -0.394 | 71% |
| GBPCAD | average | ATR | TRUE | TRUE | -65.19% | 0.226% | 71.2% | 8459 | -0.971 | 73% |
| GBPCAD | double | STD | FALSE | FALSE | 25.43% | 24.555% | 39.1% | 1250 | 0.564 | 99% |
| GBPCAD | double | STD | TRUE | FALSE | 28.3% | 39.133% | 12.2% | 1203 | 0.865% | 99% |
| GBPCAD | double | STD | TRUE | TRUE | 48.86% | 58.341 | 10.7% | 1382 | 1.296 | 99% |
| GBPCAD | double | ATR | FALSE | FALSE | 255.36% | 69.083% | 55.7% | 5632 | 2.202 | 97% |
| GBPCAD | double | ATR | TRUE | FALSE | -8.46% | 3.877% | 20.6% | 1913 | -0.276 | 98% |
| GBPCAD | double | ATR | TRUE | TRUE | -45.97% | 0.601% | 55% | 8459 | -0.982 | 98% |
| USDJPY | average | STD | FALSE | FALSE | -1.72% | 0.014% | 2.1% | 805 | -1.603 | 71% |
| USDJPY | average | STD | TRUE | FALSE | -0.22% | 2.848% | 0.6% | 785 | -0.373 | 72% |
| USDJPY | average | STD | TRUE | TRUE | -0.42% | 1.26% | 0.7% | 1135 | -0.596 | 72% |
| USDJPY | average | ATR | FALSE | FALSE | -2.13% | 0.062% | 2.3% | 4548 | -1.347 | 72% |
| USDJPY | average | ATR | TRUE | FALSE | -0.41% | 0.020% | 0.4% | 1455 | -1.242 | 72% |
| USDJPY | average | ATR | TRUE | TRUE | -1.56% | 0.001% | 1.7% | 8251 | -2.611 | 71% |
| USDJPY | double | STD | FALSE | FALSE | -1.68% | 0.006% | 2% | 805 | -1.76% | 98% |
| USDJPY | double | STD | TRUE | FALSE | -0.22% | 0.74% | 0.4% | 785 | -0.65 | 97% |
| USDJPY | double | STD | TRUE | TRUE | -0.37% | 0.169% | 0.5% | 1135 | -0.931 | 97% |
| USDJPY | double | ATR | FALSE | FALSE | -1.91% | 0.057% | 2.3% | 4548 | -1.355 | 94% |
| USDJPY | double | ATR | TRUE | FALSE | -0.24% | 0.17% | 0.3% | 1455 | -1.081 | 98% |
| USDJPY | double | ATR | TRUE | TRUE | -0.58% | 0.512% | 0.8% | 8251 | -1.342 | 96% |
| AUDJPY | average | STD | FALSE | FALSE | -2.51% | 0.048% | 3.4% | 621 | -1.314 | 67% |
| AUDJPY | average | STD | TRUE | FALSE | -0.78% | 1.384% | 1.5% | 573 | -0.597 | 67% |
| AUDJPY | average | STD | TRUE | TRUE | -1.55% | 0.23% | 2.3% | 898 | -1.013 | 67% |
| AUDJPY | average | ATR | FALSE | FALSE | -4.13% | 0.032% | 5% | 3883 | -1.45 | 71% |
| AUDJPY | average | ATR | TRUE | FALSE | -0.78% | 0.003% | 0.9% | 1303 | -1.446 | 67% |
| AUDJPY | average | ATR | TRUE | TRUE | -2.56% | 0.001% | 3% | 8211 | -2.624 | 70% |
| AUDJPY | double | STD | FALSE | FALSE | -2.05% | 0.048% | 2.9% | 621 | -1.287 | 97% |
| AUDJPY | double | STD | TRUE | FALSE | -0.33% | 2.78% | 0.7% | 573 | -0.415 | 96% |
| AUDJPY | double | STD | TRUE | TRUE | -0.71% | 0.632% | 1.1% | 898 | -0.8 | 96% |
| AUDJPY | double | ATR | FALSE | FALSE | -3.47% | 0.057% | 4.4% | 3883 | -1.334 | 93% |
| AUDJPY | double | ATR | TRUE | FALSE | -0.41% | 0.174% | 0.6% | 1303 | -1.09 | 97% |
| AUDJPY | double | ATR | TRUE | TRUE | -1% | 0.263% | 1.6% | 8211 | -1.495 | 97% |
| EURGBP | average | STD | FALSE | FALSE | 193.48% | 55.86% | 59.3% | 1342 | 1.777 | 69% |
| EURGBP | average | STD | TRUE | FALSE | 184.33% | 64.133% | 53.2% | 1325 | 1.84 | 70% |
| EURGBP | average | STD | TRUE | TRUE | 236.89% | 71.59% | 50.1% | 1451 | 2.168% | 71% |
| EURGBP | average | ATR | FALSE | FALSE | -73.2% | 14.02% | 94.5% | 4041 | 0.244 | 69% |
| EURGBP | average | ATR | TRUE | FALSE | -66.65% | 0% | 67.4% | 1120 | -1.394 | 63% |
| EURGBP | average | ATR | TRUE | TRUE | -91.09% | 0.013% | 91.2% | 8343 | -0.948 | 70% |
| EURGBP | double | STD | FALSE | FALSE | 255.97% | 71.420% | 42.5% | 1339 | 2.178 | 98% |
| EURGBP | double | STD | TRUE | FALSE | 216.28% | 93.866% | 19.4% | 1325 | 2.811 | 98% |
| EURGBP | double | STD | TRUE | TRUE | 226.02% | 94.772% | 19.4% | 1451 | 2.905 | 98% |
| EURGBP | double | ATR | FALSE | FALSE | -36.14% | 20.836% | 91.2% | 4037 | 0.53 | 96% |
| EURGBP | double | ATR | TRUE | FALSE | -48.93% | 0% | 49.4% | 1120 | -1.949 | 97% |
| EURGBP | double | ATR | TRUE | TRUE | -73.37% | 0.084% | 73.4% | 8343 | -1.016 | 96% |
| GBPUSD | average | STD | FALSE | FALSE | -21.81% | 13.698% | 75.7% | 814 | 0.223 | 72% |
| GBPUSD | average | STD | TRUE | FALSE | -0.3% | 15.694% | 63.5% | 783 | 0.301 | 74% |
| GBPUSD | average | STD | TRUE | TRUE | 37.20% | 27.093% | 52.8% | 1016 | 0.678 | 76% |
| GBPUSD | average | ATR | FALSE | FALSE | -60.85% | 12.303% | 91.1% | 5090 | 0.169 | 73% |
| GBPUSD | average | ATR | TRUE | FALSE | -39.26% | 0.47% | 47.2% | 1651 | -0.744 | 71% |
| GBPUSD | average | ATR | TRUE | TRUE | -90.26% | 0.002% | 93.4% | 8325 | -1.192 | 70% |
| GBPUSD | double | STD | FALSE | FALSE | -2.78% | 15.241% | 55.2% | 814 | 0.276% | 98% |
| GBPUSD | double | STD | TRUE | FALSE | 11.13% | 17.60% | 40% | 785 | 0.355 | 98% |
| GBPUSD | double | STD | TRUE | TRUE | 13.85% | 18.86% | 38.6% | 1018 | 0.395 | 98% |
| GBPUSD | double | ATR | FALSE | FALSE | -15.88% | 20.194% | 89.3% | 5090 | 0.472 | 93% |
| GBPUSD | double | ATR | TRUE | FALSE | -19.0% | 2.947% | 38.5% | 1651 | -0.378 | 97% |
| GBPUSD | double | ATR | TRUE | TRUE | -71.33% | 0.1% | 83.4% | 8325 | -1.181 | 98% |
Post-analysis
Across all scenarios and all foreign currency pairs, we can see that the strategy returns range from 230% to -90%. The Sharpe ratios range from 2.2 to -2.6. It seems that the grid trading strategy is not very stable in terms of capturing profit. On the other hand, not surprising that the win rate is as high as 70% to 97%. These stats can clearly infer that our strategy can efficiently capture the profit when the price fluctuates. Sadly those trades that didn’t win actually cause us humongous losses.
Let’s do another round of analysis to look into the details of all the scenarios.
First, let’s look at the difference between using standard deviation and using ATR (Average True Range) indicator as our grid range. Apparently, the standard deviation is more outstanding in terms of predicting the proper range of price change.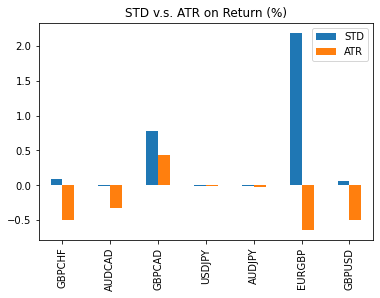
Ill. VI. STD v.s. ATR on Returns (%)
We don’t see much difference between using average allocation and double down allocation to control our position allocation on each bar.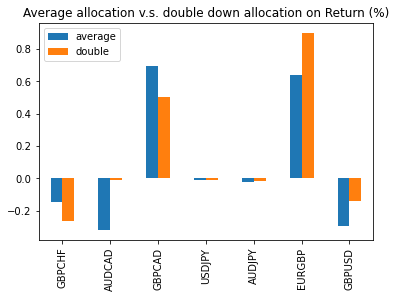
Ill. VII. Average allocation v.s. double down allocation on Returns (%)
Lastly, let’s take a look at whether the stop-loss mechanism will help improve the quality of our trades. The strategy returns in all scenarios unanimously reduced a great certain percentage. In the meantime, the MDD (Max Drop Down) was also greatly reduced when applying the stop loss method. Unexpectedly, the stop loss and rescale method even deteriorate both the strategy return and MDD compared to the scenarios applying the stop-loss method.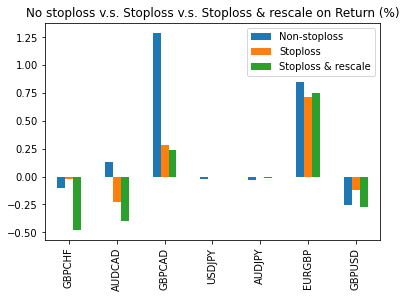
Ill. VIII. Stoploss on Returns (%)
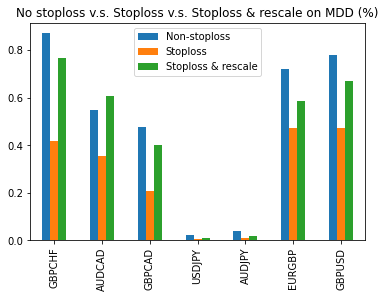
Ill. VIII. Stoploss on MDD (%)
Conclusion
In short, the grid trading strategy has done what we ask it to capture all the profitable opportunities when the price fluctuates among our monitoring grid range. However, when the price moves in one direction in a short period of time, the potential cost could cost us the entire portfolio. The global economy and international politics are the origins of this sudden price change which we cannot predict. Unless we’re able to produce a stop loss method or hedge instrument to help us mitigate the risk and endure the sudden price movement, the grid trading strategy wouldn’t be able to help us consistently capture the risk-free profit.
To do that, here are a few topics that we can explore to further optimize our grid trading strategy:
- Better stop loss method
- Using technical indicators to help identify and avoid the upward/downward trends.
- Try to experiment with different foreign currency pairs, as each currency pair has its own characteristic. Some possess high volatility, and some are relatively stable.
That’ll be all for this post. Cheers.
Appendix
References
- A primer on grid trading strategy
- What’s the relation between grid trading and delta hedging
- Fundamental of grid trading strategy
- Grid trading
- How to pick the right currency pair to trade as a Forex beginners?
- Grid trading bot Part 2
Code
1 | import pandas as pd |


