
I have to admit that my attention was drawn by the name of this indicator at the first glance. Therefore my interest in implementing a series of backtesting against this indicator was unavoidable. In today’s article, we’re going to introduce what Supertrend indicator is about and how to produce one yourself. After that, I will show you a series of backtest that I have performed and see what we can get out of them.
Introduce Supertrend indicator
What is Supertrend
Supertrend indicator was created by Olivier Seban to help identify trends and to know when to buy or sell a financial asset. Similar to Bollinger Bands, Supertrend involves an upper band and a lower band that is derived from the close price in order to find out the signals to show the trend of prices. Essentially, it is a trend-following (lagging) indicator.
When we construct the Supertrend indicator strategy, the default parameters involve using Average True Range (ATR) with the period of 14 and another parameter of 2 as its multiplier. The average true range (ATR) plays a key role in Supertrend as the indicator uses ATR to compute its upper- and lower- band values in results triggering the buy and sell signals.
Pros and cons of Supertrend
However, Super Trend needs to be used in conjunction with other indicators like RSI, MACD, and any other technical indicators in order to produce more accurate and confirmed signals. Moreover, Supertrend also works best with a trailing stop-loss for the existing trades and acts as strong support or resistance.to use in combination with other indicators like MACD and RSI. We can list its pros and cons below to quickly understand Supertrend:
- Advantages of SuperTrend Indicator
- The best thing about Supertrend is it sends out accurate signals.
- The indicator offers a quick technical analysis to intraday traders.
- It is easy to use and understand.
- Disadvantages
- The Supertrend is not appropriate for all situations, which works when the market is trending.
- Supertrend is best for singling out the trend, but it needs to cooperate with other indicators to decide the best timing to trade.
- Supertrend uses only the two parameters of ATR and multiplier. They are not sufficient under certain conditions to predict the accurate direction of the market.
How to calculate Supertrend indicator
Here I’m using the research book from QuantConnect to demonstrate the calculation of Supertrend indicator.
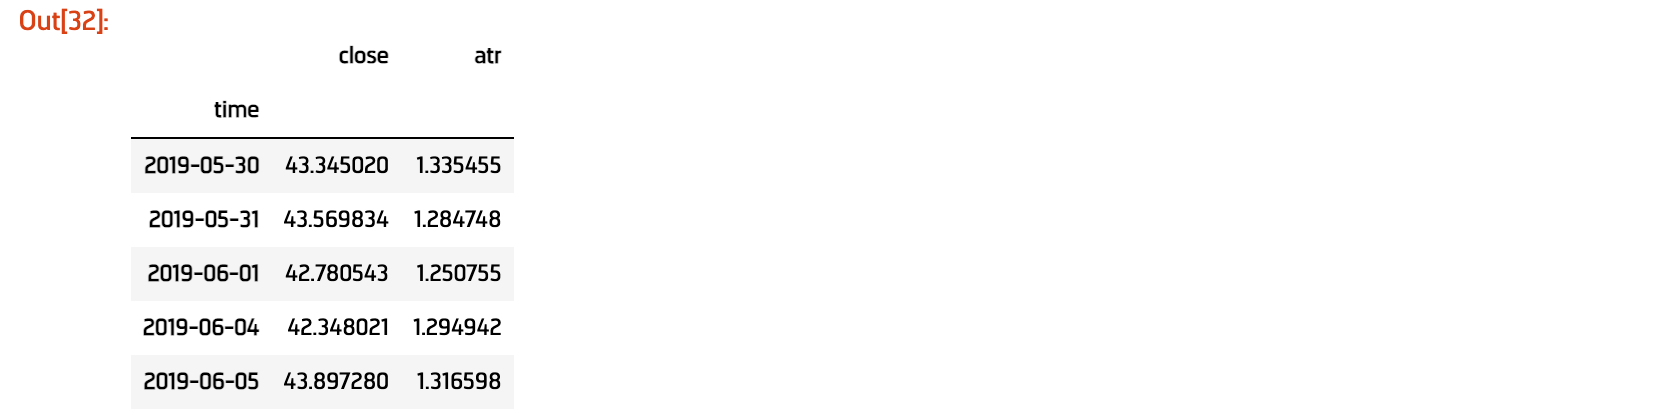
1. Retrieve close and ATR data
First of all, we need to retrieve the close price and the ATR indicator from historical data:1
2
3
4
5
6
7
8
9
10qb = QuantBook()
stock = qb.AddEquity("AAPL")
history = qb.History(qb.Securities.Keys, 720, Resolution.Daily)
atr = qb.Indicator(AverageTrueRange(14), stock.Symbol, 720, Resolution.Daily)
his = history.swaplevel().droplevel(1)
his['atr'] = atr['averagetruerange']
his.dropna(inplace=True)
his[['close', 'atr']].head()
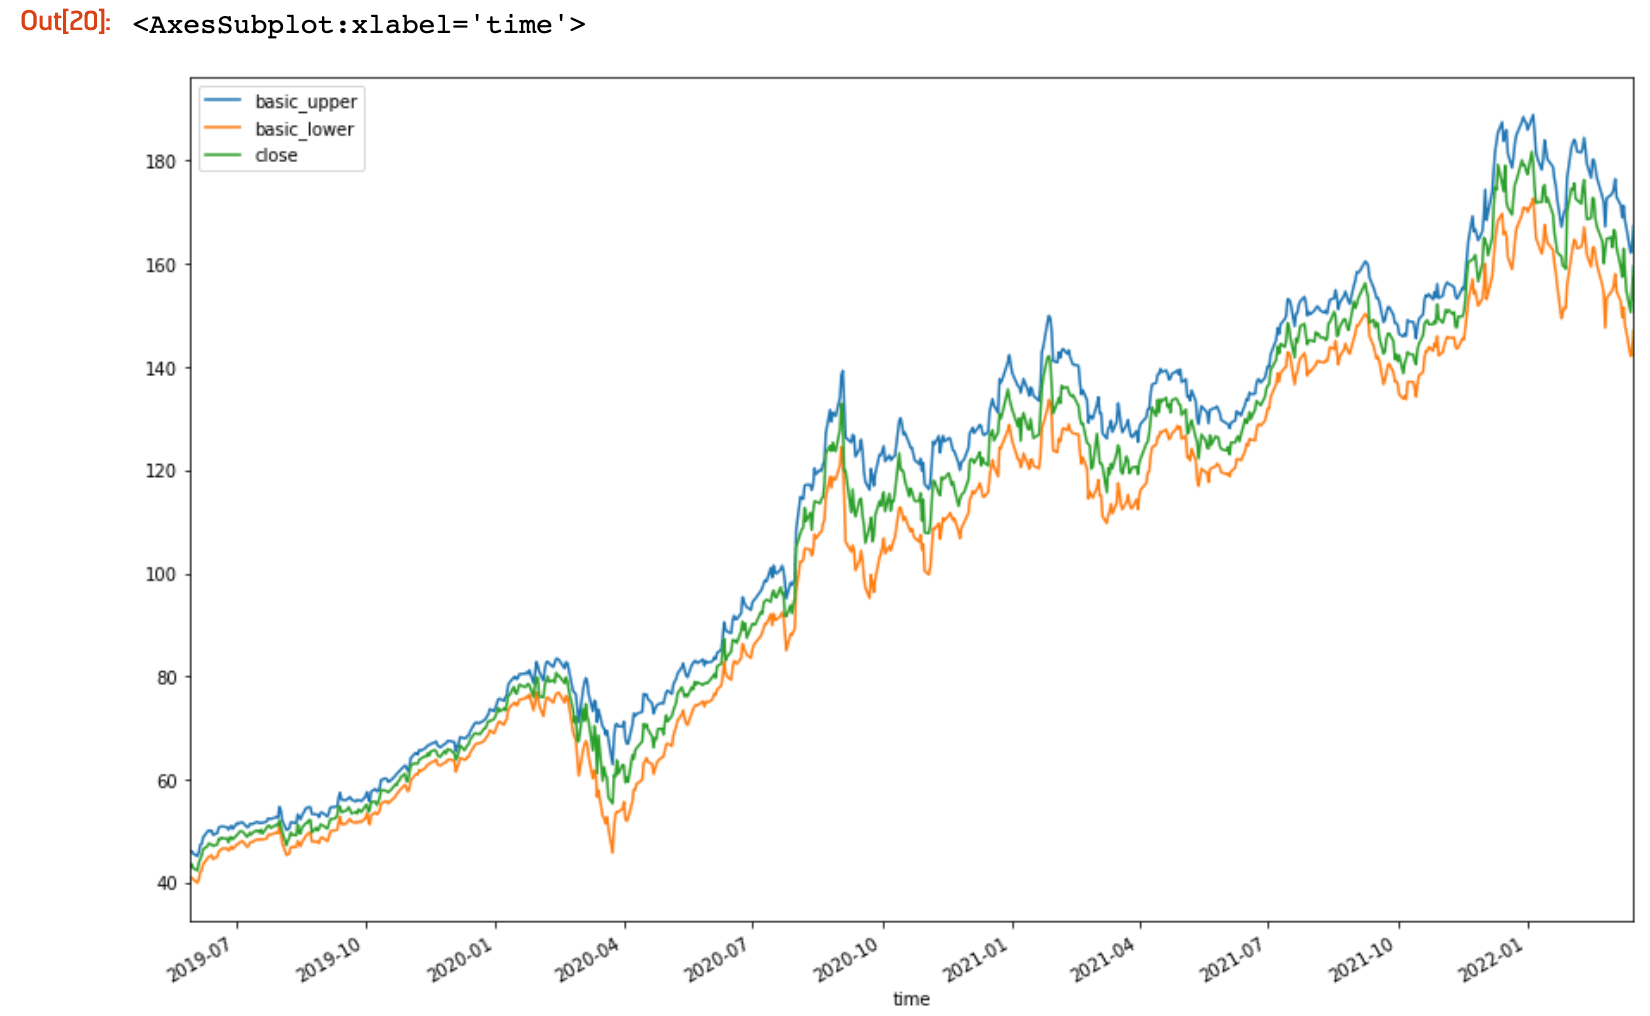
2. The basic upper- and lower- bands
Then we need to calculate the basic upperband and lowerband utilizing the daily 14-period ATR. These basic bands fundamentally are the volatility through using the ATR indicator to see the possible fluctuation against current close price. The formulas are as follows:
1 | his['hl2'] = (his['high'] + his['low'])/2 |
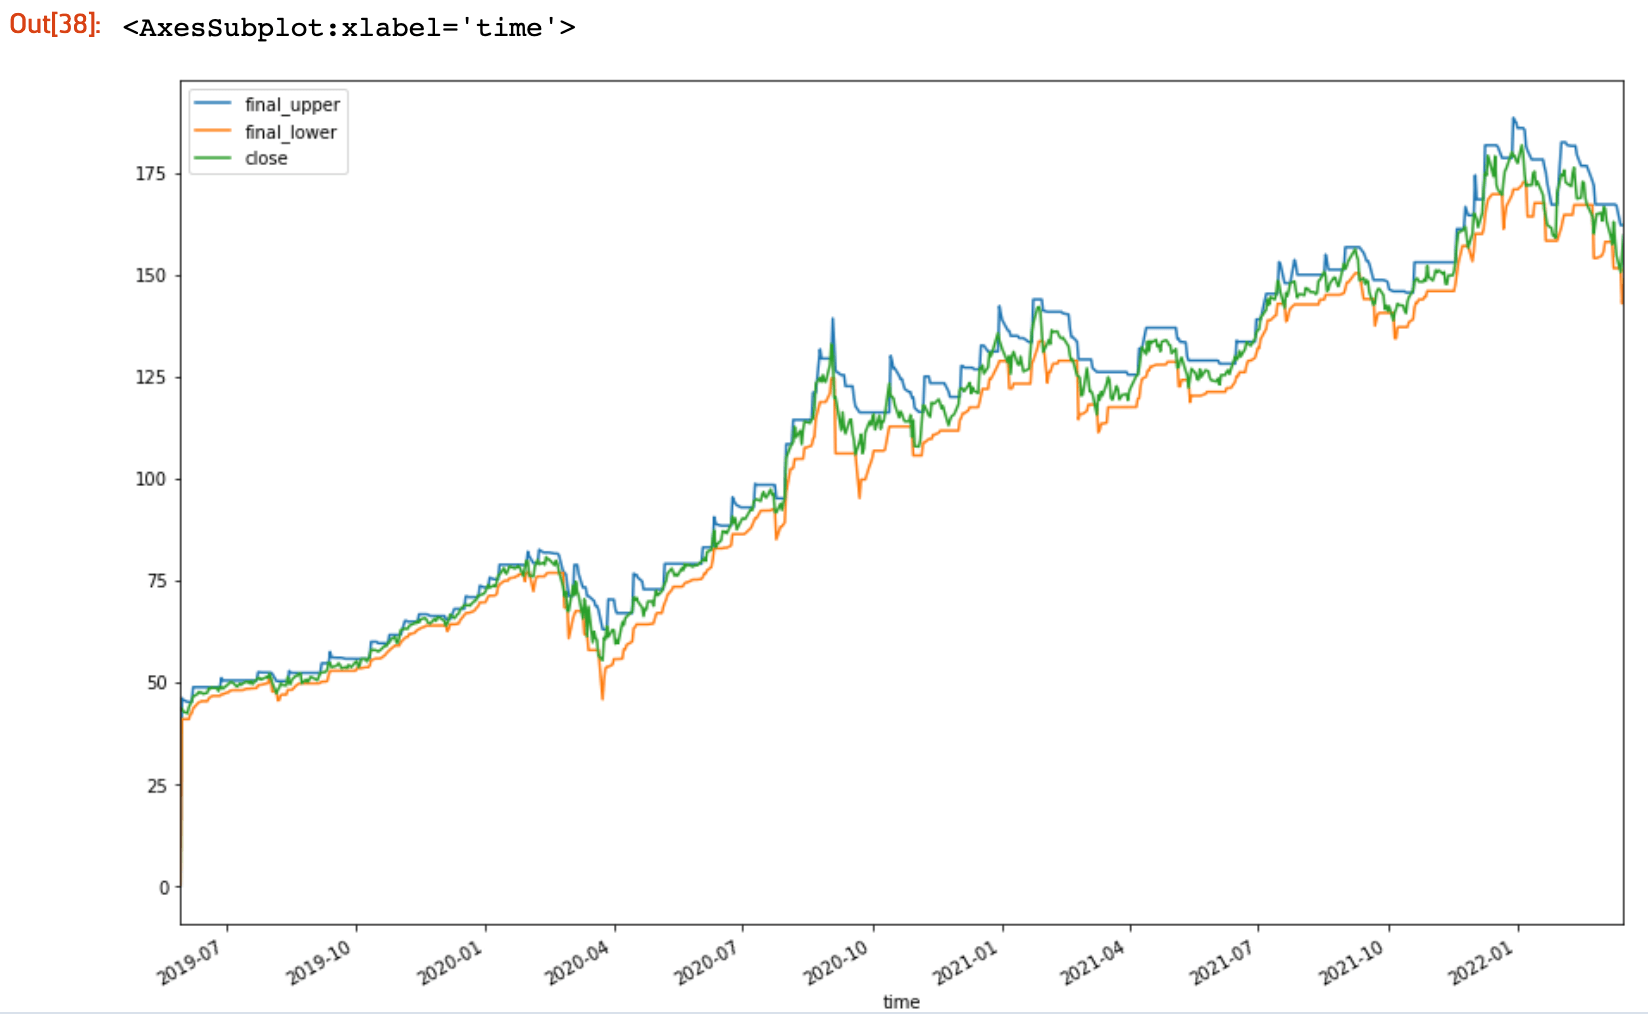
3. Calculate the final upper- and lower- bands
This step is to smooth the basic upperband and lowerband. In many indicators, we use moving average or other techniques to smooth the bands. Here we’re trying to use a different way to smooth them.
1 | his['final_upper'] = his['basic_upper'] - his['basic_upper'] |
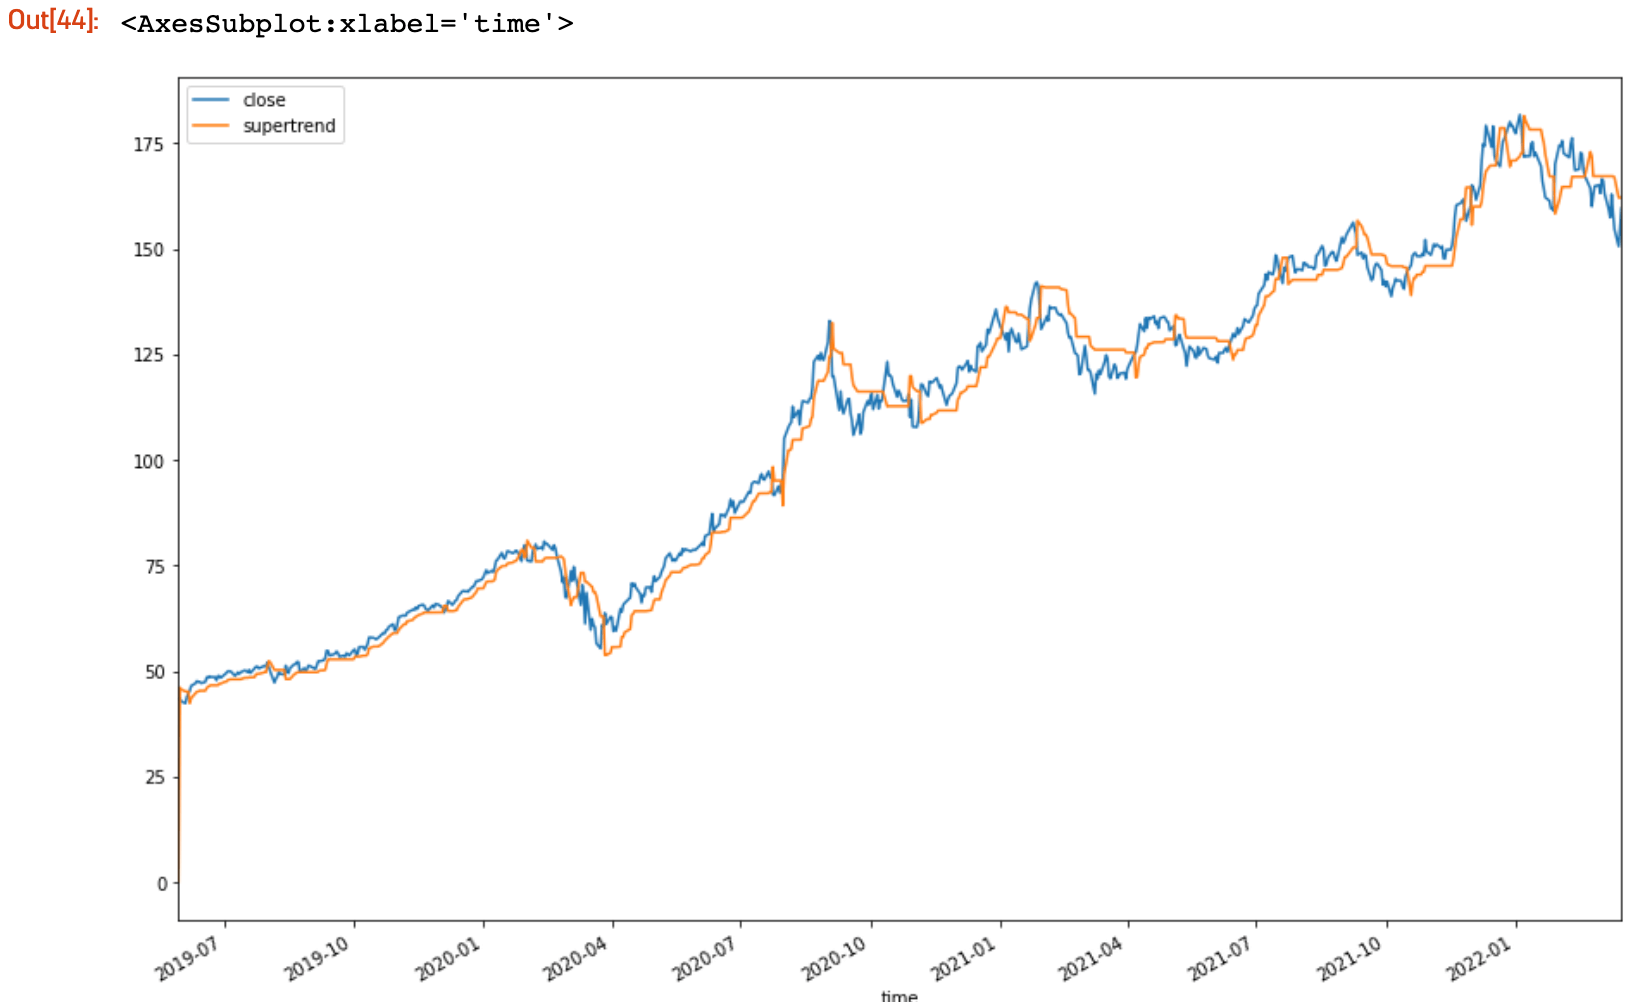
4. Define the Superband indicator
Lastly, we’re going to assemble the Superband with all the components that we have constructed above.
1 | his['supertrend'] = his['basic_upper'] - his['basic_upper'] |
Strategy setups for our backtests
After introducing what Superband is and how to calculate it, we’re now going to backtest this indicator in conjunction with other indicators and see how they perform.
Platform
Universe
- Sort stocks by
PERatio,EPS,ROE,NetIncomeand take top 60% - Sort stocks by
PBRatio, from high to low
Rebalancing strategy
- Recalculate our universe and indicators every day.
- We keep 10 stocks that have buy-in signals and with the highest
PBRatio. - We assign weight to each position evenly.
- We don’t adjust the weight of each stock until we close these positions.
Backtest time frame
Backtest Date: 2019, 1 ,10 ~ 2022, 2, 14
Signal generation
There’s no technical indicator that can be 100% accurate and so is Supertrend. Therefore we are going to backtest the performance of it combining other famous indicators.
1. Supertrend momentum strategy
In this strategy, we buy when the close breaks through the Supertrend indicator, and sell when the close price falls below the Supertrend indicator.
2. Supertrend mean-reversion strategy
Compared to the above strategy, we do everything in reverse. We buy when the close price falls below the Supertrend, and sell when the close price goes above the Supertrend.
3. Supertrend with RSI indicator
We buy when the close price goes above the Supertrend also when RSI is above 50, and sell when the close price is under Supertrend and when RSI is below 50.
4. Supertrend with EMA20 indicator
We buy when the close price goes above the Supertrend also when 20-day EMA is above the close price, and sell when 20-day EMA is below the close price.
5. Supertrend with EMA200 indicator
We buy when the close price goes above the Supertrend also when 200-day EMA is above the close price, and sell when 200-day EMA is below the close price.
6. Supertrend with William R indicator
We buy when the close price goes above the Supertrend also when the William R indicator is below -50, and sell when the close price is under Supertrend and when the William R indicator is above -50.
7. Supertrend with Chande momentum oscillator
We buy when the close price goes above the Supertrend also when the Chande momentum oscillator is below -50, and sell when the close price is under Supertrend and when the Chande momentum oscillator is above 50.
8. Supertrend with 10% trailing stop loss
In addition to the setup of the first momentum strategy, we add a trail stop loss if the close price falls 10% in two consecutive days.
Backtest result
| Strategy | Total Trades | PSR | Unrealized | Fee | Net profit | Return | Sharpe | Average Win | Average Loss | Compounding annual return | MDD | Profit-loss ratio | Win rate | Alpha | Beta | Annual variance |
|---|---|---|---|---|---|---|---|---|---|---|---|---|---|---|---|---|
| momentum | 607 | 41.256% | $12622.29 | -$2470.65 | $132108.37 | 142.34% | 1.007 | 1,83% | -0.75% | 32.7% | 32.9% | 2.43 | 42% | 0.152 | 0.684 | 0.064 |
| momentum_trailing_loss | 635 | 22.944% | $9576.2 | -$2201 | $59980.43 | 67.39% | 0.698 | 1.32% | -0.69% | 17.898% | 30.2% | 1.91 | 42% | 0.017 | 0.603 | 0.042 |
| mean-reversion | 366 | 21.47% | -$17538.55 | -$1295.34 | $83620 | 64.81% | 0.665 | 1.09% | -1.33% | 17.315% | 35.2% | 0.82 | 70% | 0.013 | 0.873 | 0.046 |
| rsi | 607 | 41.256% | $12622.29 | -$2470.65 | $132108.37 | 142.34% | 1.007 | 1,83% | -0.75% | 32.7% | 32.9% | 2.43 | 42% | 0.152 | 0.684 | 0.064 |
| ema20 | 970 | 10.581% | $3031.88 | -$3230.26 | $32780.4 | 34.6% | 0.433 | 1.05% | -0.46% | 9.437% | 30.6% | 2.26 | 35% | 0.01 | 0.496 | 0.037 |
| ema200 | 164 | 33.474% | -$3699 | -$640.42 | $161398.96 | 157.22% | 0.913 | 6.00% | -1.20% | 35.251% | 38.5% | 4.98 | 36% | 0.087 | 1.013 | 0.108 |
| william_r | 28 | 24.792% | $63412 | -$68 | $19756 | 83.14% | 0.733 | 4.90% | -1.44% | 21.336% | 41.00% | 3.39 | 56% | -0.011 | 0.891 | 0.058 |
| chande_momentum | 0 | 0 | $0 | $0 | $0 | 0 | 0 | 0 | 0 | 0 | 0 | 0 | 0 | 0 | 0 | 0 |
Takeout from the backtest results
The SPY return in our backtest period is around 74%. By looking at the statistics above, all the backtests seem very promising. But all the PSR (Probabilistic Sharpe Ratio) are fairly low (See here if you don’t know what PSR stands for). Also, the win rate in every backtest scenario is hardly over 50%. All these facts indicate that our Supertrend strategies don’t work really well.
There are other things that we can try to add to optimize our strategies:
- Find the appropriate universe that fit the nature of the Supertrend indicator.
- Fine-tune the parameters used in our indicators
- Combine the Supertrend indicator with other indicators.
Of course, exploring the combination of different indicators could be a good way to level up your backtest score. But make sure you don’t go too extreme and go overfitting. Remember, history won’t repeat itself in the stock market. What we’re doing here is simply trying to find a way that can help us better confirm the time when the trend changes.


