
We talked about how to use MACD indicator and other secondary indicators to tell when to long certain stocks in the previous articles. If you haven’t read them yet, below are the links to catch up on where we left. But, is this the end of the optimization of our trading strategy? In this article, we’re going to demonstrate the power of RSI indicators and see how this indicator can be a help to our current trading strategy.
- How to save your silver bullets with MACD strategy?
- Optimize your MACD strategies with advanced indicators
Train of thought - How to optimize our trading strategy

Train of thought
1. Where to start?
The definition of optimizing the trading strategy can be simplified as increasing the money you make in this very trading strategy. It always comes down to two directions: either profit more, or you lose less compared to our benchmark strategy. Instead of spending more time studying the topic of stopping loss, I decided to give it one more shot to add another momentum indicator to see whether that can better time the entry.
2. What I have in the trading strategy
The MACD indicator I have adopted in our strategy is a momentum indicator, indicating the stock price trend by using 9-day EMA and 26-day EMA. When the fast EMA(9-day EMA) crosses above the slow EMA(26-day EMA), it gives us the idea that the stock price seems to have the tendency to go upward.
3. What we can add to the trading strategy
Since we have the future tendency indicator, I believe we also need to indicator to point us where the stock price is at compared to the stock price these days. There are many options, such as SMA (Simple Moving Average), oscillators, Bollinger Bands, we can choose from. Here, we pick the RSI indicator to apply to our strategy.
4. What is RSI?
The Relative Strength Index (RSI) is a momentum indicator used in technical analysis that measures the magnitude of recent price movement and evaluates overbought or oversold conditions in the price of a stock or other asset. The MACD, on the other hand, measures the momentum of those price moves. This means that an asset could be overbought or oversold but is still able to show positive momentum in that direction. When both indicators concur, we get a better idea of what is the state of the current stock price, enhance the confidence of our bet side, and hopefully increase our win rate and total profit. In short, the indicator constructed in our trading strategy would consist of:
- MACD: Prediction of the future trend
- Awesome Oscillator: Confirmation of the future trend
- RSI: Past price history and movement
5. Formula of RSI / Calculation of RS and RSI
Let’s quickly go through the calculation of RSI:
The formula of RSI / Calculation of RS and RSI
Let’s see how to calculate a 14-day period. We say there is a stock that has \$2 growth for eight days in this 14-day period, and -\$2 decrease for six days. So we will get our RS value by doing:
$RS = \frac{2 \times 8}{14} \div \frac{2 \times 6}{14} = 1.333$
Our RSI will be:
$RSI = 1 - \frac{100}{1+1.333} = 57.13$
As the RSI indicator is in a form of the oscillator, it ranges from 0~100. A stock would usually be considered as oversold when if the RSI is lower than 30, indicating a bullish price momentum in order to revert the RSI back to the average range. On the other hand, a stock would be deemed as overbought when the RSI is higher than 70. Just like the below stock price of Amazon (AMZN)
AMZN stock price
6. Limitations of RSI
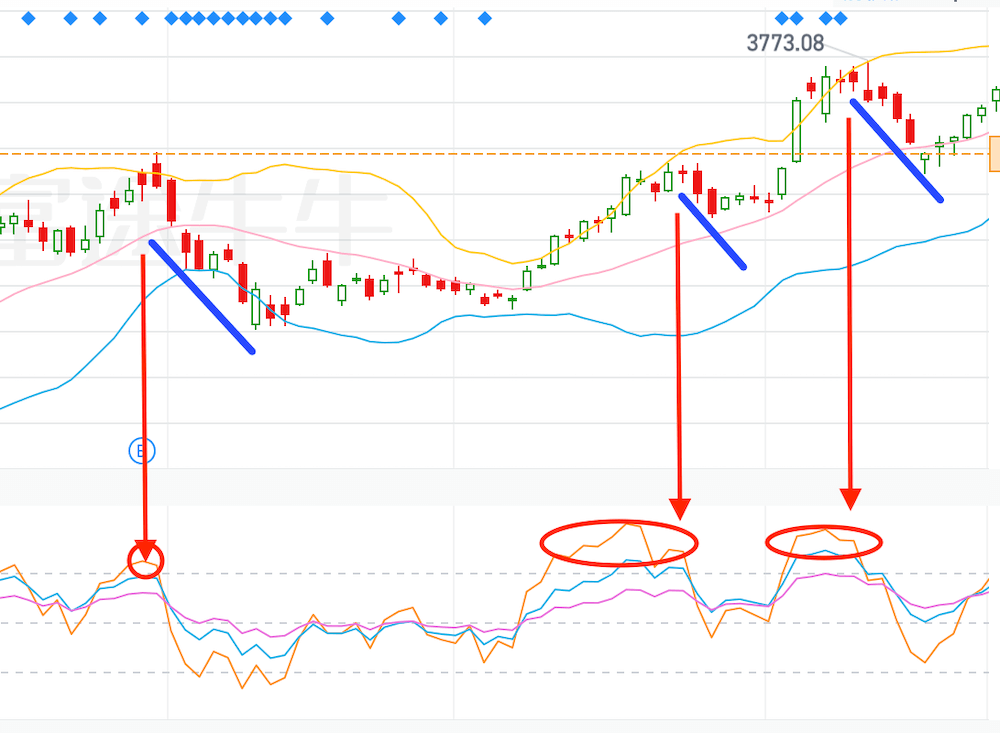
RSI is one of the most popular day trading strategy indicators since it was developed in 1978. You can find tons of articles on the internet about what RSI can achieve. However, when a market is in a strong trend, RSI loses its usefulness. Why? Because RSI can remain overbought or oversold for long periods providing the trader misleading signals.
Below is the stock price of Tesla (TSLA) since September, 2021. The RSI in the red rectangle stays above 70-line for over a month and has no signs of reverting. This is the exact example illustrating that the strong bullish momentum would generate wrong signals.
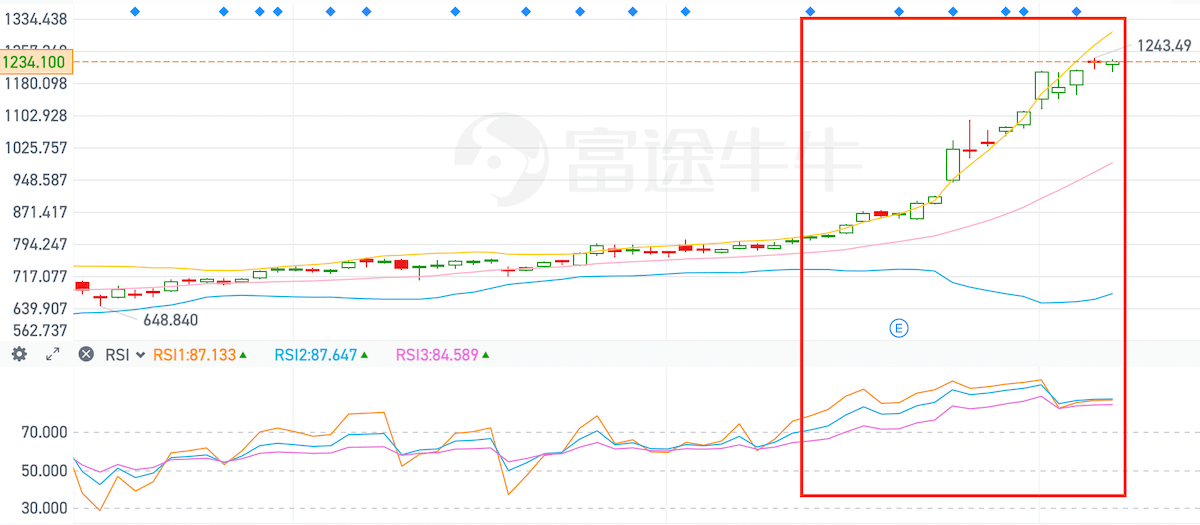
TSLA stock price since September, 2021
In other words, blindly executing a trade based on overbought or oversold signals is definitely not a good idea. Indicators are tools to help you quickly have a big picture of the specific stock, but they won’t help you enough if you don’t understand the market context or company-specific risk.
Strategy setups for our backtests
After introducing what RSI is and what are we going to use it for, let’s get back to the business: constructing our trading and preparing for the backtest. This strategy is going to use the strategy we built before in here and here
Platform
Universe
- Sort stocks by
PERatio,EPS,ROE,NetIncomeand take top 60% - Sort stocks by
PBRatio, from high to low
Rebalancing strategy
- Recalculate our universe and indicators every day.
- We keep 10 stocks that have buy-in signals and with the highest
PBRatio. - We assign weight to each position evenly.
- We don’t adjust the weight of each stock until we close these positions.
Signal generation
As written in the title of this article, we’re going to introduce four different RSI strategies and see how our trading strategy can benefit by adding any one of them. Now, we quickly talk about how each type of RSI indicator strategy:
1. The Moving Average of RSI
The very first strategy is that we use SMA (Simple Moving Average) to smooth the RSI.
Formula of SMA
The benefit of applying SMA on the RSI we have acquired is that we can reduce the frequency of our threshold to be triggered. A lot of times that the threshold was reached because the anomaly/abnormal price movements were generated due to a certain of market events. You can tell from the below chart, that the smoothed RSI line triggered twice only compared to the original RSI line that triggered five times.
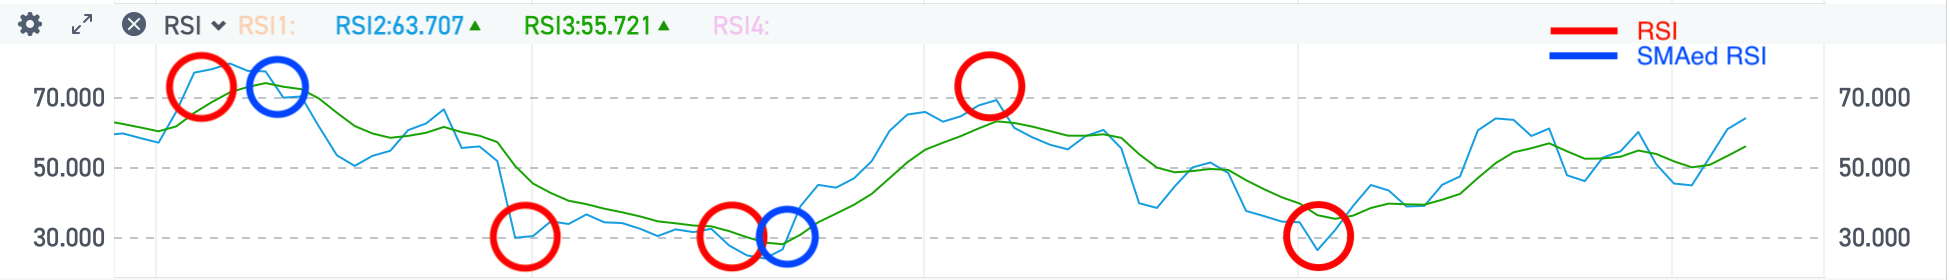
RSI V.S. smoothed RSI
- Buy signal: Original buy signal + SMA of RSI < 30 (which tells us that this stock is potentially oversold at the moment)
- Sell signal: Original sell signal
Note: We’re not going to add the RSI signal in our selling signal generation rule. Our intention is to buy when all signals confirmed the same direction, but sell when the future prediction indicator MACD tells us that the upward trending is over.
2. RSI stack
The concept of the RSI stack is to use multiple consecutive time frames to further confirm the relative strength. Taking the example from the post Alpaca & Backtrader: Tools of the Trade (Part 1), you can see that the author uses 15m, 30m, 1h three different time frames to confirm the relative strength is strong enough to start bidding on the reverting direction. Since here we are constructing our strategy to run on a daily basis, we use 1d, 2d as the time frame to confirm the strength of the current trend.
- Buy signal: Original buy signal + $RSI_{n} < 30$ + $RSI_{n-1} < 30$
- Sell signal: Original sell signal
3. The RSI² Leading Indicator
As the RSI is derived directly from the stock price movements, so the RSI indicator value will highly depend on the market condition overall. Therefore in this post suggests that we can perform another RSI function over the original RSI, called $RSI^2$. This will tell us when will the original RSI meets the extreme conditions and start to revert to the opposite direction.
- Buy signal: Original buy signal + $RSI^2 < 30$
- Sell signal: Original sell signal
4. The Stochastic-RSI Indicator
Stochastic Oscillator is a technique that normalizes our value into a range from 0 ~ 1. We usually time 100 to the result so that the number is more approachable, ranging from 0 ~ 100. The outcome tells us that we either stand at the top (> 70) or at the bottom (<30) in the range of historical RSI.
- Buy signal: Original buy signal + $\text{Stochastic RSI} < 30$
- Sell signal: Original sell signal
Other parameters
Backtest Date: 2019, 1 ,10 ~ 2021, 10, 25
Backtest results
Below are the backtests that were performed according to our constructed strategies. In addition to those strategies we mentioned above, I have conducted another set of backtests using EMA (Exponential Moving Average) to calculate our RSI just for reference. The results are quite aligned between these two types of RSI calculations.
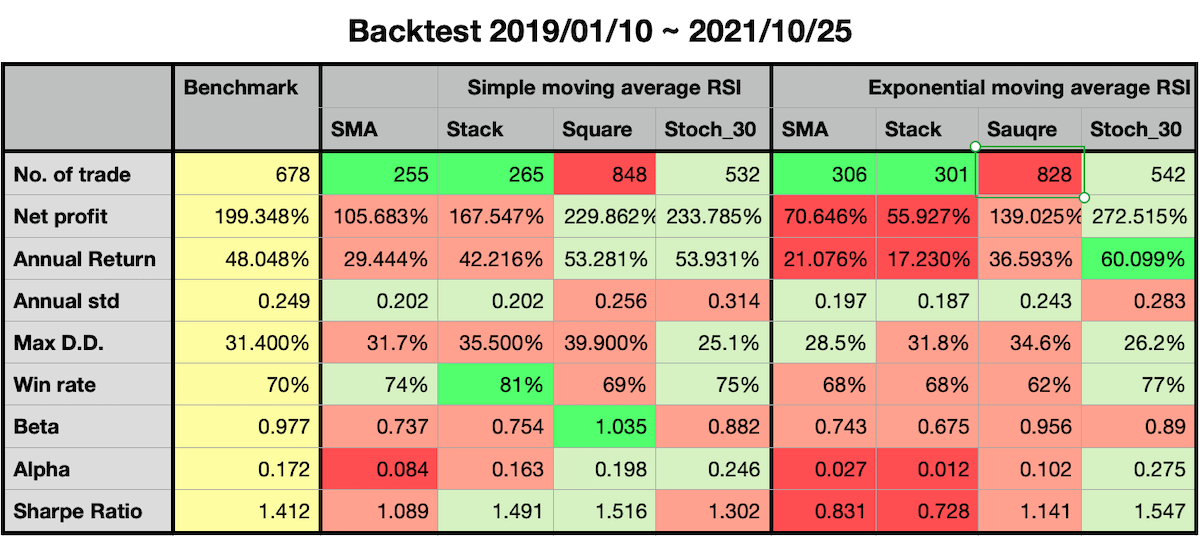
Backtest results summary
Backtest diagrams
1. The Moving Average of RSI
| SMA of RSI (Simple) | SMA of RSI (Exponential) |
|---|---|
 Results of using SMA to construct RSI |
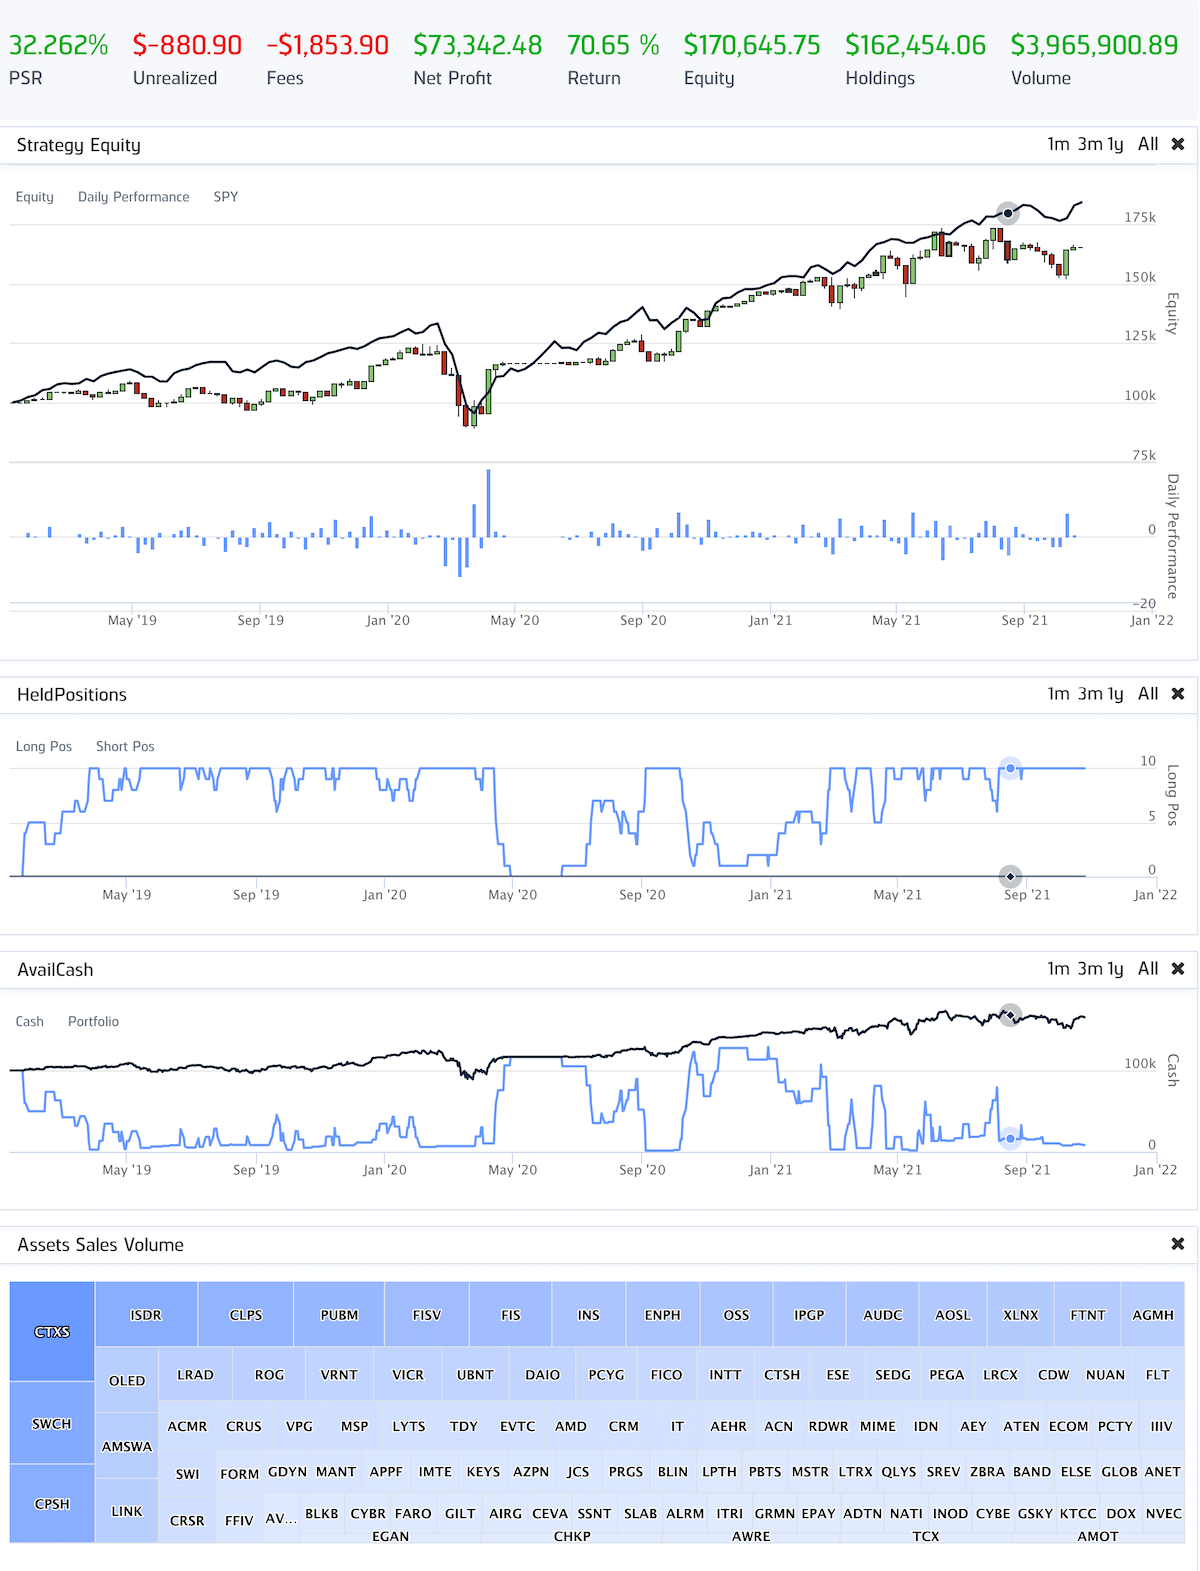 Results of using EMA to construct RSI |
With the help from the RSI, Our net profit doesn’t seem to increase. Referring to both the backtest results and the diagram, there are fewer trading signals generated and the higher win rate compared to the benchmark strategy. However, the net profit slides drastically from 199.348% to around 100%. This could be a sign that there are too few valid trading signals were generated. Also, let’s look at the period after the outburst of COVID. There are no trades made for at least 5 months, meaning this strategy wasn’t able to capture the opportunities during the recovery of the economy. As survivors of post-market after the COVID outburst, we all know by now that the best opportunity is actually lying behind the downturn of the market.
2. RSI stack
| RSI Stack (Simple) | RSI Stack (Exponential) |
|---|---|
 Results of using SMA to construct RSI |
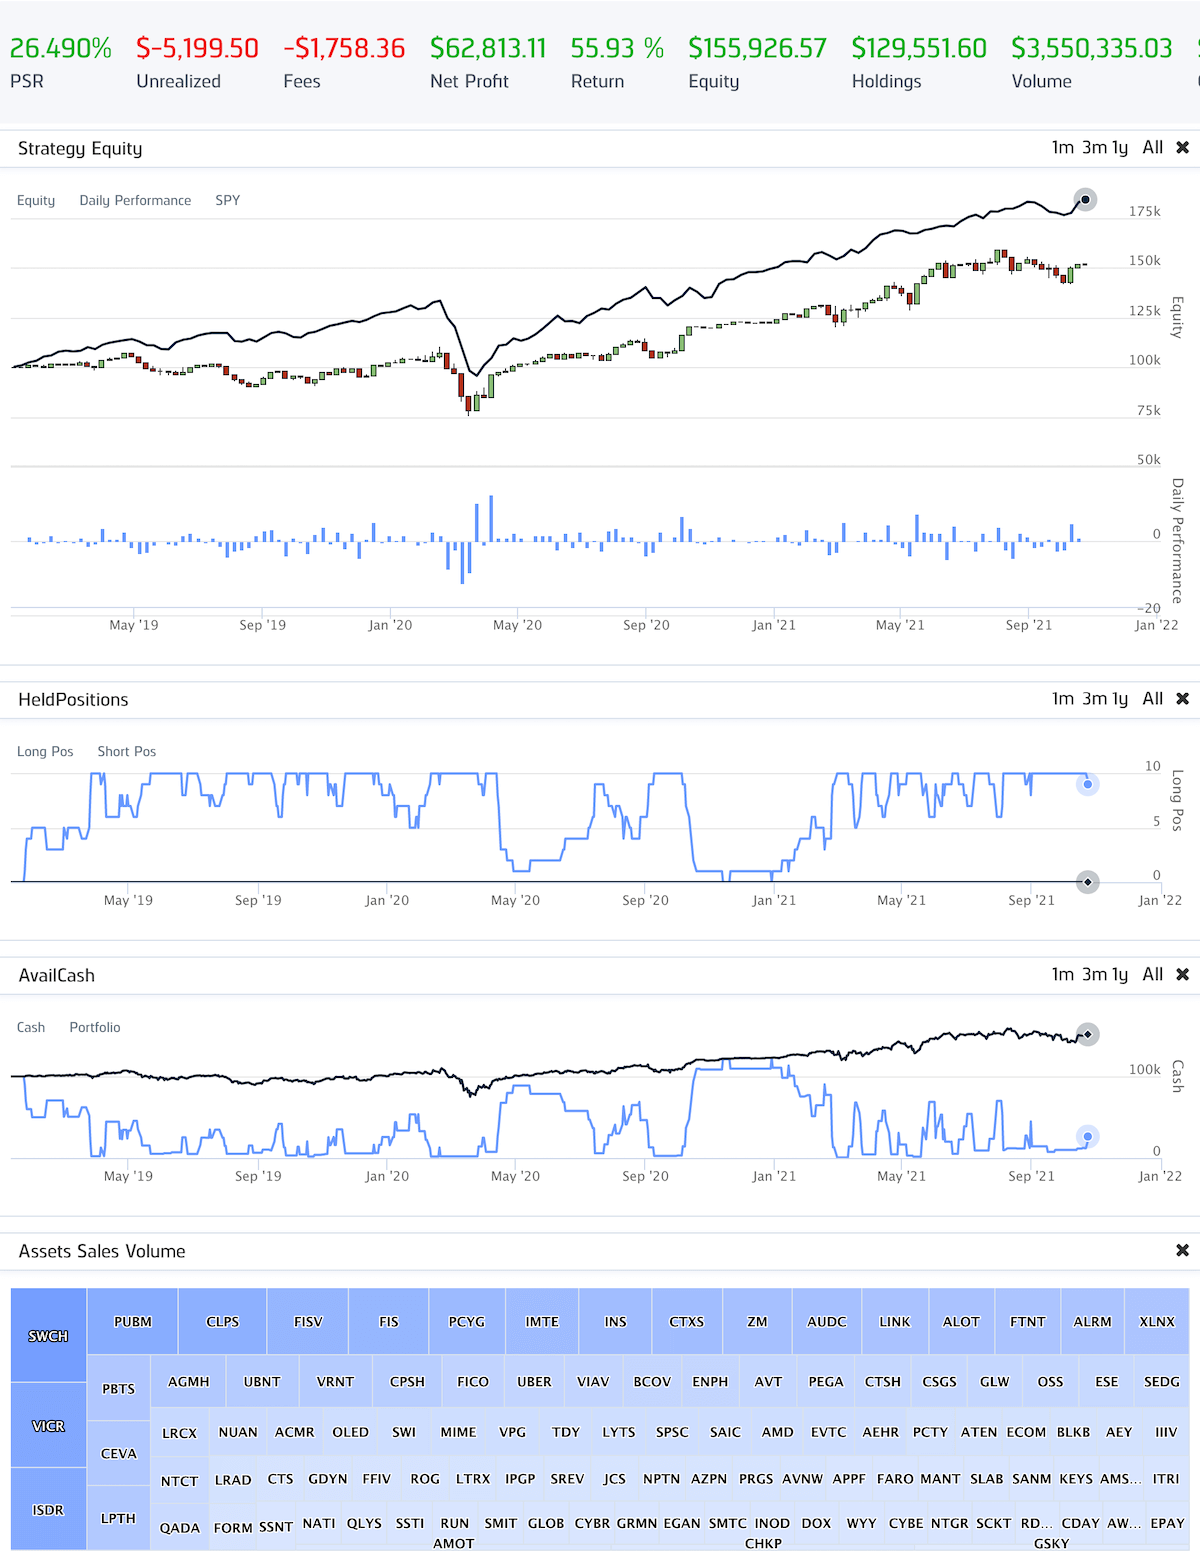 Results of using EMA to construct RSI |
The RSI stack doesn’t seem to really help confirm the direction and relative strength. Same as the SMA of RSI strategy, even though the win rate did rise to 80% of total trades, the profitability of this strategy still doesn’t seem promising.
3. The RSI² Leading Indicator
| SMA of RSI (Simple) | SMA of RSI (Exponential) |
|---|---|
 Results of using SMA to construct RSI |
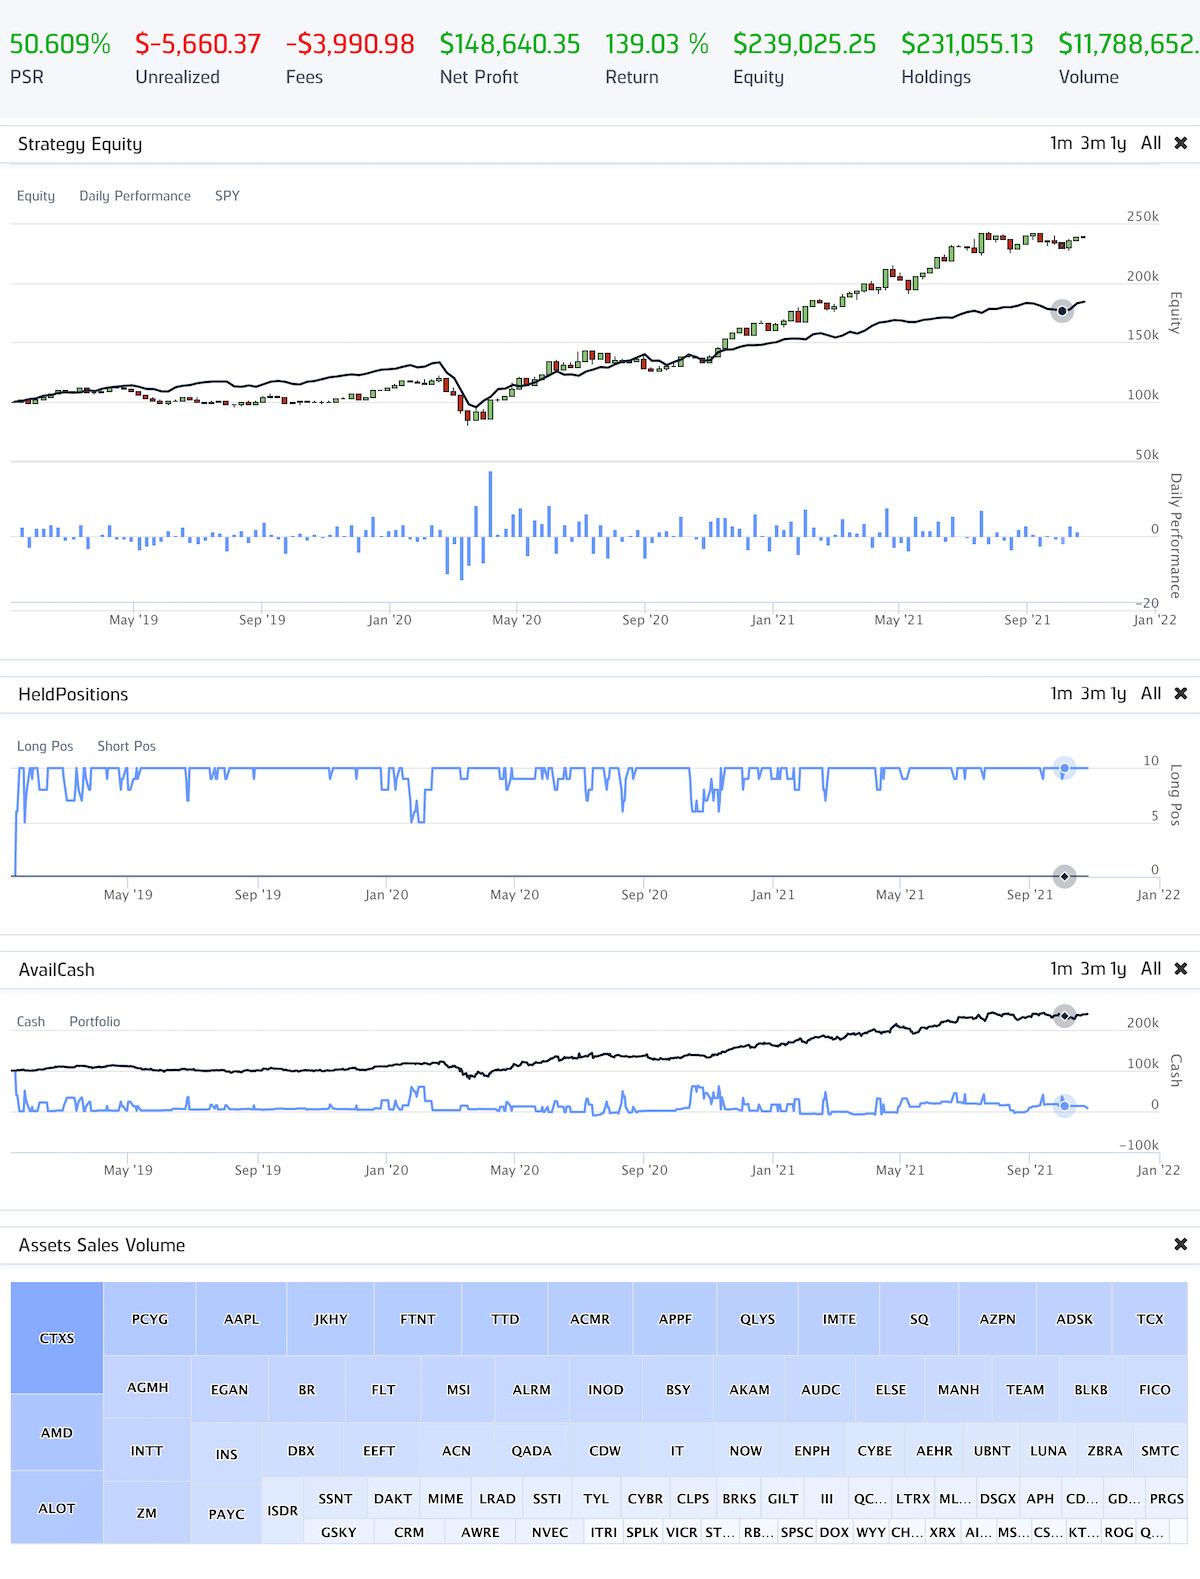 Results of using EMA to construct RSI |
By looking at the stat number of trades and the diagram HeldPositions, we can confirm that now this strategy does generate enough signals to perform effective trading. The profitability has increased but the annual standard deviation has worsened. Even though the net profit looks attractive, all the stats and diagrams don’t profit enough confidence for us to go all-in.
4. The Stochastic-RSI Indicator
| SMA of RSI (Simple) | SMA of RSI (Exponential) |
|---|---|
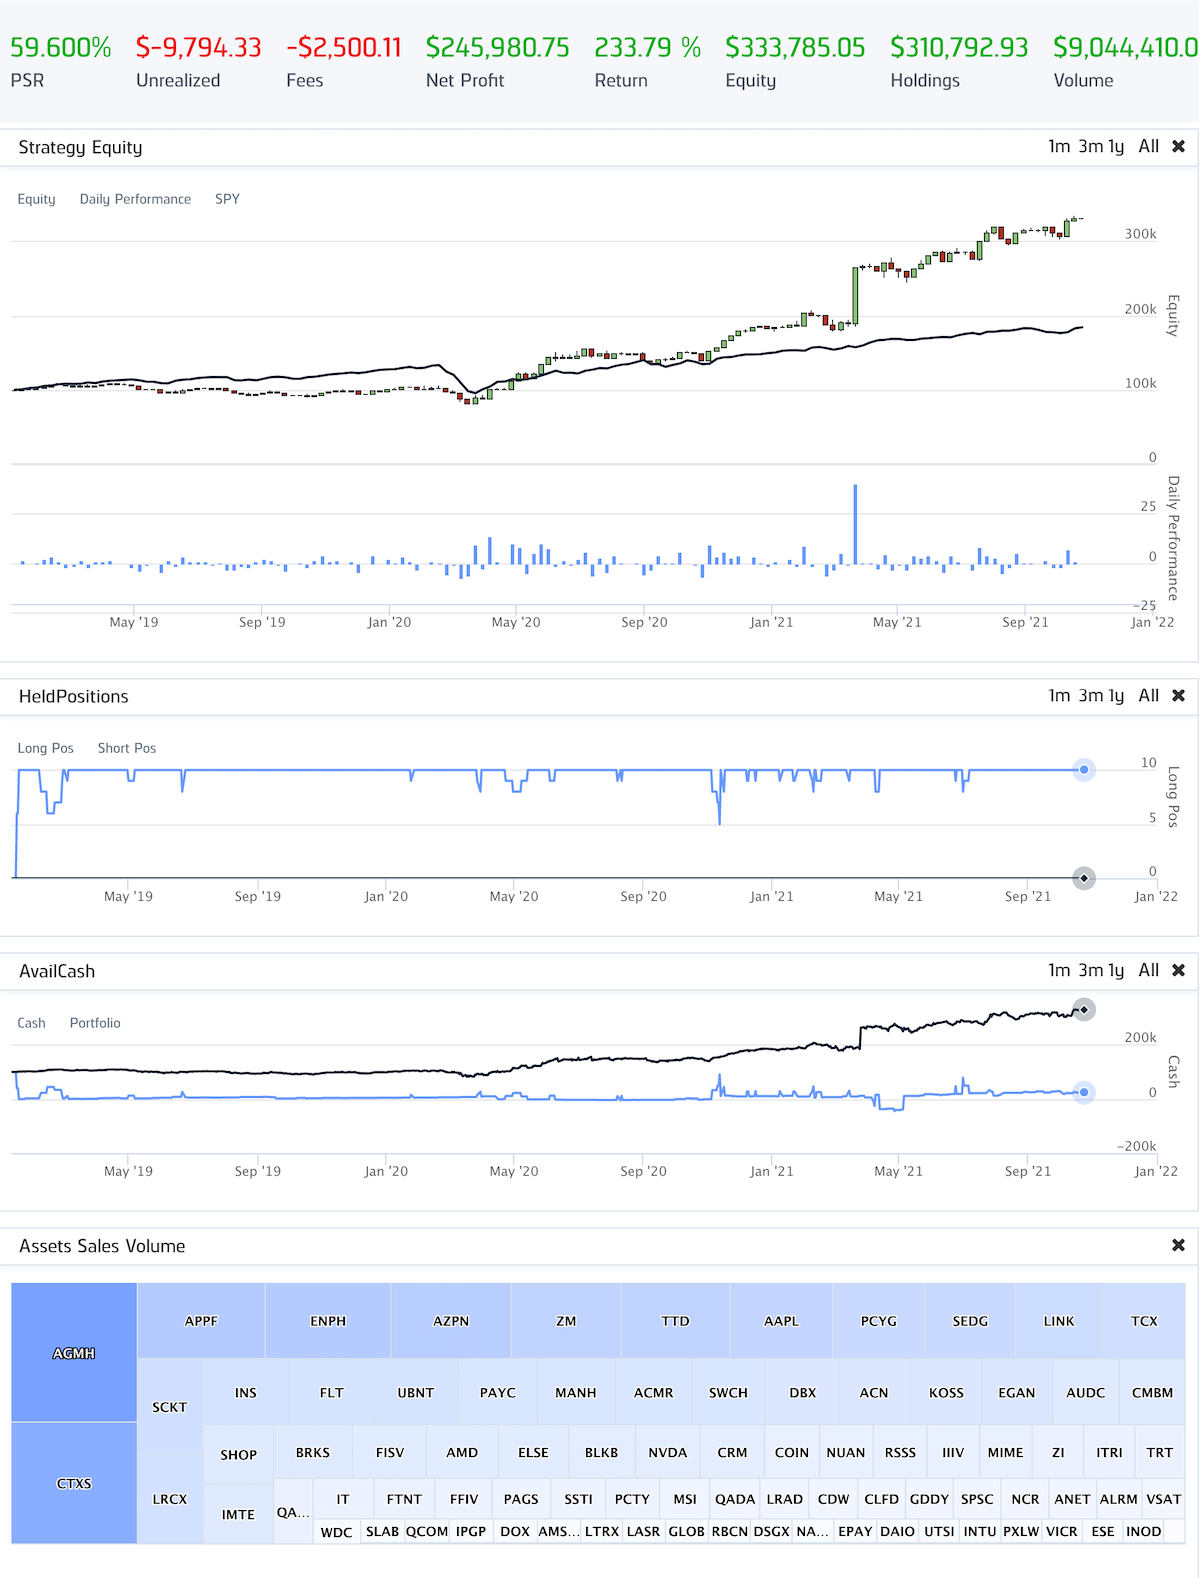 Results of using SMA to construct RSI |
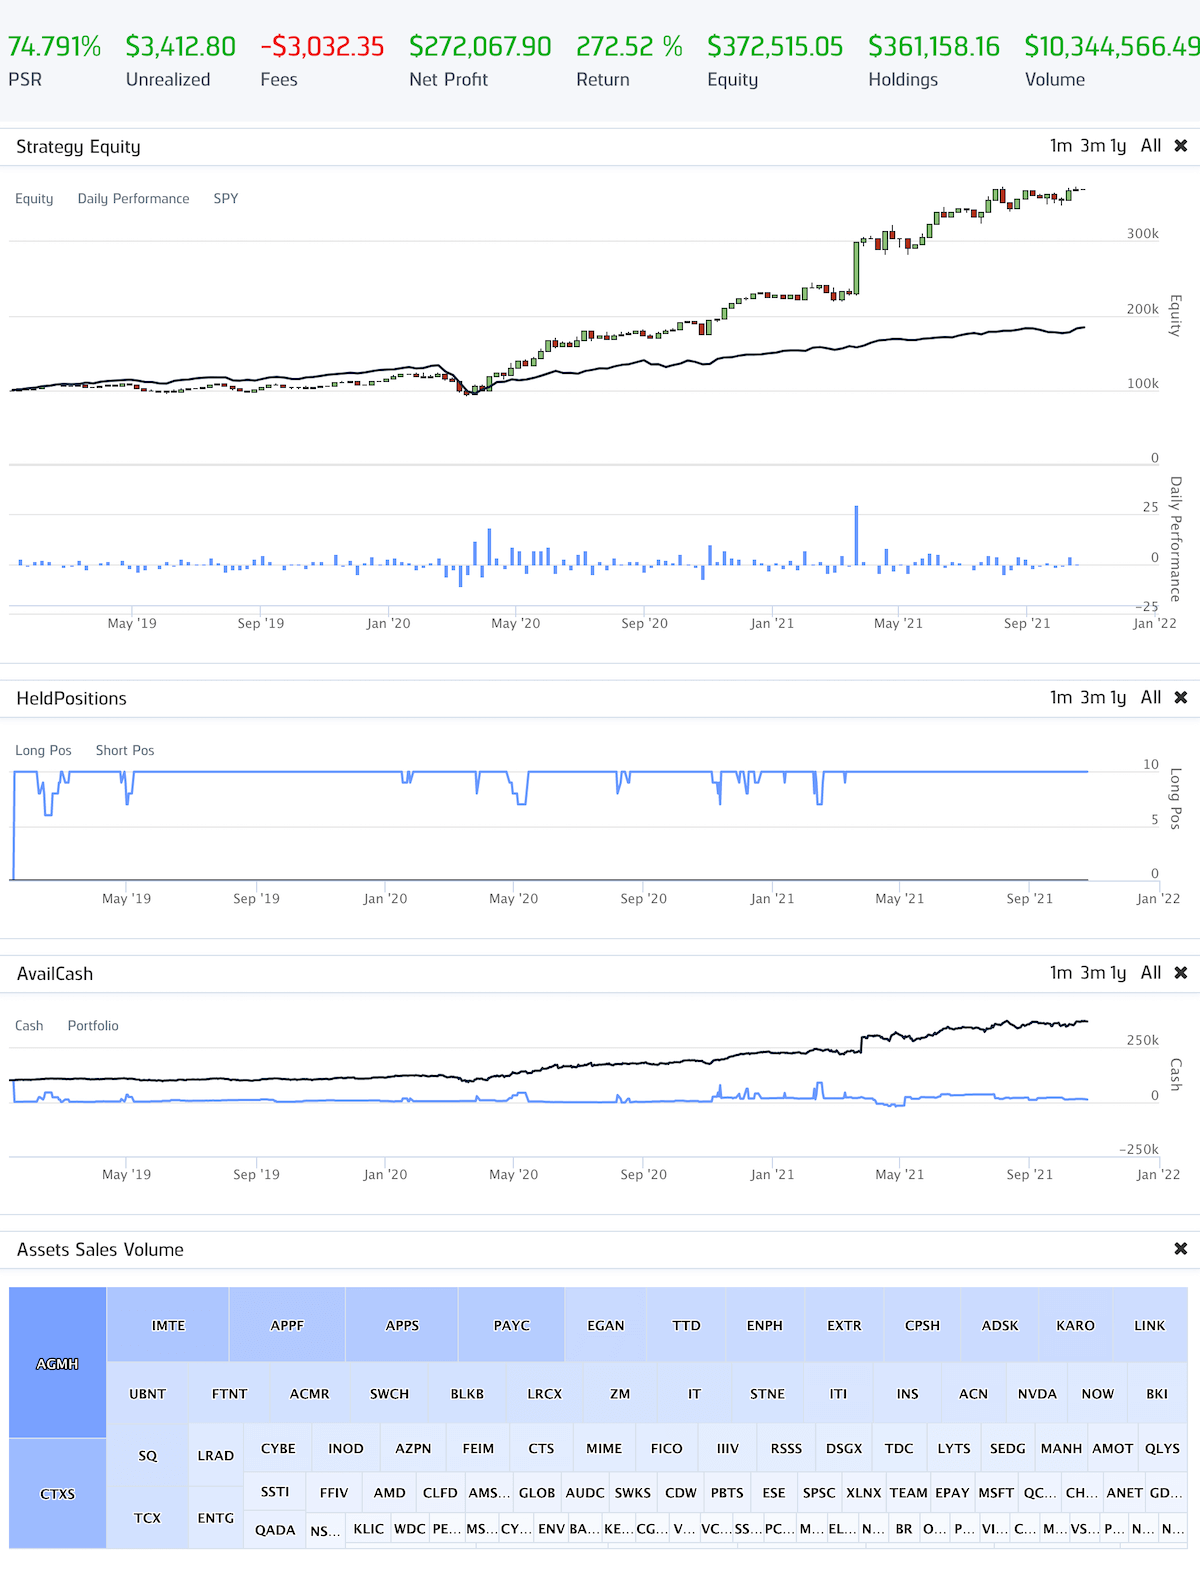 Results of using EMA to construct RSI |
This RSI strategy looks relatively promising as both the stats and the diagrams outperform the benchmark and the other RSI strategies. Also, if you look at the diagram, we’re able to outperform the benchmark performance after the COVID outburst. This could potentially indicate that this strategy is capable of capturing the opportunities during the market growth, but is unable to profit from the bumpy market condition.
Delivery
One thing worth mentioning is that even though we have one successful backtest, it doesn’t 100% ensure that we’re going to get the same profit if we put this strategy to life.
Seems all our backtests don’t give us enough confidence to say whether it’s a good enough strategy to launch it. However, there are still a lot of possibilities of the RSI that can be explored. For example, so far we have used cross above/under the threshold as the trigger of the RSI signals. Yet, we can try staying put when we cross above/under the threshold and trigger our signals when the RSI reverts back from the threshold to confirm the trend is indeed happening. This exploration could take a serious amount of time. But like what Larry Swedroe, the Director of research for Buckingham Strategic Wealth once said, “when you are trying to time the markets, you have to be right twice: going in, and going out“. You need to double in the efforts so that you’ll get the comparable rewarding.
Larry Swedroe
Director of research for Buckingham Strategic Wealth
Misc
Reference
- https://tradingsim.com/blog/stochastic-rsi/
- RSI Trade Settings Explained + 4 Unique Trading Strategies
- Trading Techniques — The Moving Average of RSI
- RSI stack part I & part II
- The RSI² Leading Indicator. Detecting Trend Exhaustion Early in Trading.
- The Stochastic-RSI Indicator
- 4 Simple RSI Trading Strategies
- Trend Confirmation Strategy Using the RSI in Python.
- The more signals the better? Stochastic RSI vs. RSI


