
After reading the post How to Improve Investment Portfolio with Rebalancing Strategy in Python by Bee Guan Teo, I was thrilled to know that this trading strategy can be that powerful and the portfolio return is greater than any of my existing trading strategies. Therefore I decided to give it a try and backtest this strategy to verify the profitability it claimed.
Extracting the essences of the strategy
First of all, we extracted several things from the post in order to formulate the skeleton of our backtest strategy.

Perform the autopsy on the trading strategy
1. Platform
I’m using QuantConnect to backtest this seemingly lucrative strategy.
2. Universe
Instead of using a fixed set of stocks as in the original article, I’m using the following rules to filter the stocks that are similar in nature:
- Rank all the stocks by
DollarVolume - Choose stocks that are in NASDAQ and NYSE
- Filter out the stocks that are listed less than 180 days (3 months)
- Filter out the companies whose market capitalization are less than 500 million dollars
- Lastly, we sorted all the remaining stocks by Dollar Volume, and limit them to top either
100or200stocks
3. Rebalancing strategy
- As instructed in the article, we keep maximum five stocks that are most likely to rise.
- We assign weight to each position evenly.
- We don’t adjust the weight of each stock until we close this positions.
4. Signal generation
The strategy described in the article essentially is a kind of momentum strategy. It assumes that the stocks will continue to have great performances when they have good performances in the previous month. By holding this assumption, the author suggested:
- Every month we long five stocks that have the best monthly return in the previous month.
- In the next month, we abandon two stocks that have the worst performance and
- Replace them with the other two stocks that have good monthly returns in the previous month.
5. Other parameters
Other than the size of our universe, we pick backtest time frame as another parameter for us to test against with. In the end, we’re going to conduct four backtests:
- Limit the number of stocks in the universe to
100and backtest it for 2 years - Limit the number of stocks in the universe to
100and backtest it for 5 years - Limit the number of stocks in the universe to
200and backtest it for 2 years - Limit the number of stocks in the universe to
200and backtest it for 5 years
Backtest results
| Momentum-100-2y | Momentum-100-5y | Momentum-200-2y | Momentum-100-5y | |
|---|---|---|---|---|
| No. of trade | 93 | 233 | 93 | 235 |
| Return | 577.34% | 162.471% | 230.94 % | 738.94 % |
| Annual Return | 178.398% | 21.922% | 89.750% | 54.789% |
| Annual Standard Deviation | 0.546 | 0.469 | 0.476 | 0.373 |
| Max D.D. | 46.5% | 66.9% | 37.800% | 43.000% |
| Beta | 0.947 | 1.127 | 0.846 | 1.107 |
| Alpha | 1.186 | 0.132 | 0.594 | 0.306 |
| Sharpe Ratio | 2.471 | 0.594 | 1.555 | 1.205 |
Backtest results summary
Wow! Even though the backtest time span has across 5 years, the annual return rates look promising, ranging from 21% to 178%. Sharpe ratios are also telling us that we’re making a good amount of money under reasonable risk. Even though the max drawdown is a bit intimidatingly high, the huge amount of compensation looks lucrative enough to take that degree of risk. In the end, by looking at the stats of these backtests, this strategy has the potential to make some hard coin!

Hold on. Take a step back and don’t jump the gun. Let’s do a double check by looking at the return diagram of the described scenario respectively. See whether we can discover some patterns that are not hidden behind these numbers.
| Duration \ # Universe |
100 | 200 |
|---|---|---|
| 2 years | 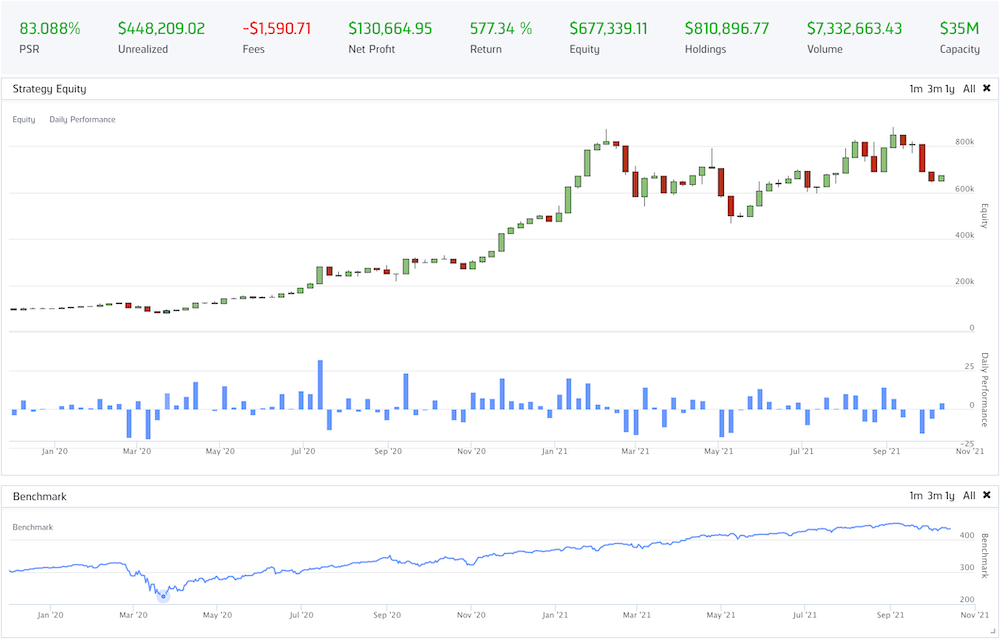 Limit universe to contain 100 stocks |
 Limit universe to contain 200 stocks |
| 5 years | 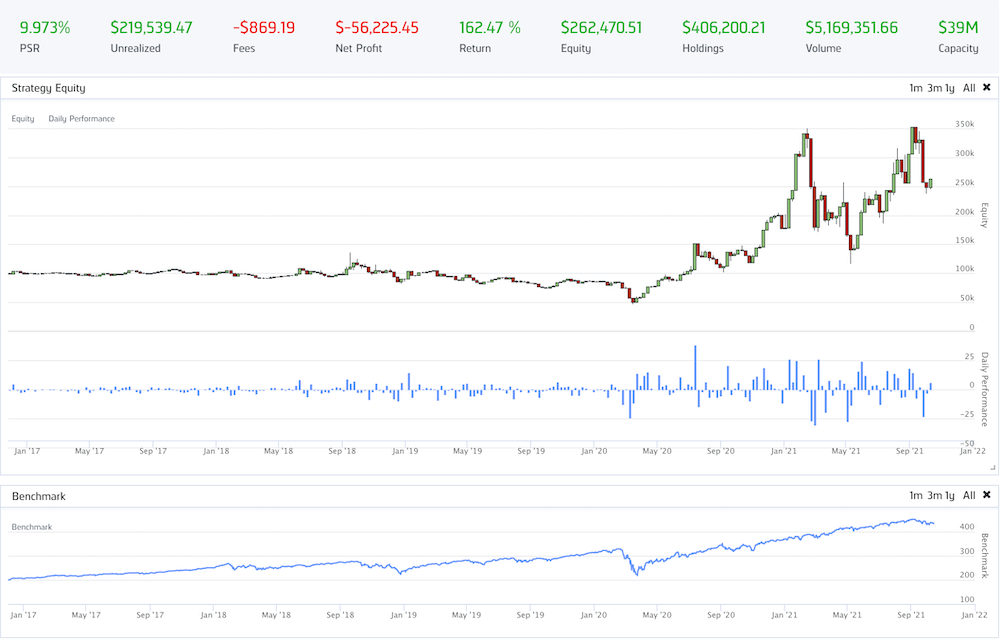 Limit universe to contain 100 stocks |
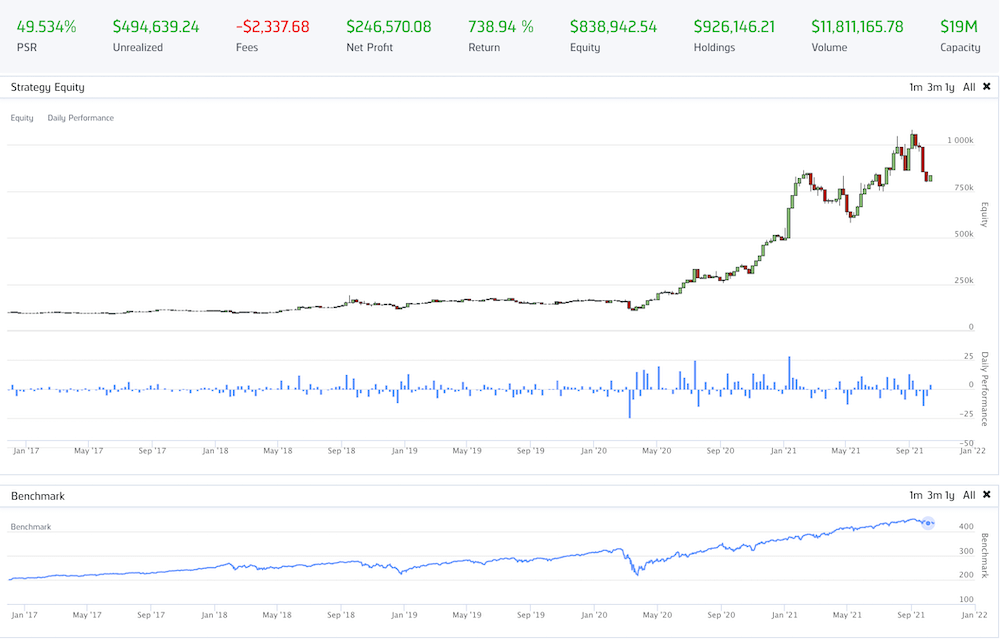 Limit universe to contain 200 stocks |
Did you notice the pattern in the above four diagrams? Apparently, the majority of the portfolio return is generated starting the late 2020s. Any time before the late 2020s actually very little return over years. This fact indicates that the portfolio return over years is contributed by luck so that we can capture this uprising wave. From the asset sales volume distribution diagram in the backtest below, you can tell that most of the return is contributed by Tesla (TSLA), ROKU (ROKU), Advanced Micro Devices (AMD), and GameStop (GME), which are highly volatile and unpredictable MEME stocks.
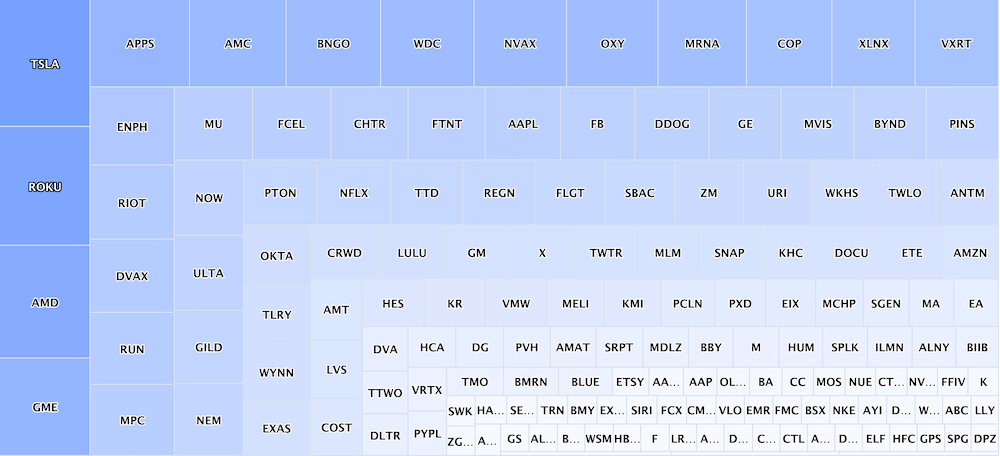
Asset sales volume over time
It’s a fair question to ask that whether this type of opportunity will continue to be captured by this strategy. Also, what if your capital won’t sustain until the day you capture this opportunity? These are the objective questions that you need to ask yourself before you adopt this as an executable trading strategy. Other than those, the number of trades and the backtest time span are also the important KPIs that I keep my eyes on. I didn’t mean to judge whether this is a good or bad strategy, but knowing the answers to the above questions can help you adjust the position of this strategy in your investment portfolio.
Appendix
Code of alpha model for QuantConnect platform
(including signal generation)
1 | from AlgorithmImports import * |


