Previous reading:
In the previous post 【Pair Trading】In-depth analysis of 5 distance approach strategies in pair trading, we have conducted various research against each variation of distance approaches in pair trading strategy. Despite the research has given us probable insights whether there is an $\alpha$ exists in the strategy we constructed, we still haven’t established our portfolio construction strategy. Here we introduce a concept called the “long-short equity (LSE)” strategy.
Therefore, the objectives of this post are consists of three:
- What is the long-short equity (LSE) strategy
- Review our backtest results to see the impact of adopting the long-short strategy
- What are the advanced strategies that we can explore
The Long-short equity (LSE) strategy
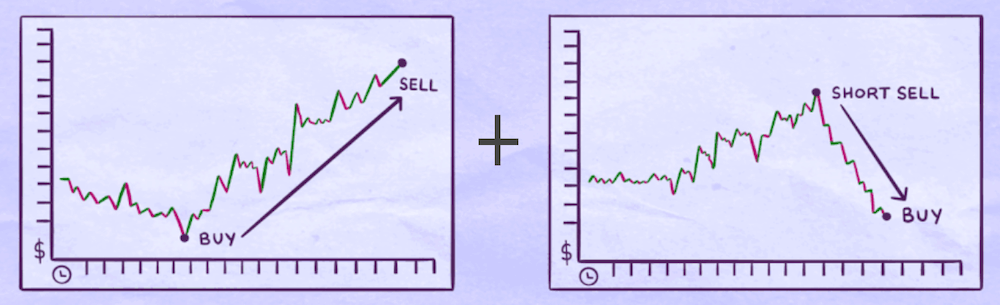
The long-short equity (LSE) strategy is an extension of the pair strategy which takes long positions in stocks that are expected to appreciate and takes short positions in stocks that are expected to depreciate. It’s a classic hedge fund investment strategy that is able to generate relatively higher risk-adjusted returns with lower volatility and smaller market-specific exposure compared to the traditional long-only portfolio.

Long-short strategy
Backtest against the distance approaches selected
Here we’re going to run backtests against the approaches we have spoken about in the previous post:
- Basic distance
- High variance
- Zero crossing
- Pearson correlation
In this series of backtests, we will adopt the long-only strategy (buy the stocks that are most likely to rise) against each of the four pair-trading approaches. In the meantime, we’re going to adopt the long-short strategy (long the stocks that are expected to appreciate, and short other stocks that are expected to depreciate) to backtest each pair-trading approach under the same conditions. By doing these, we can compare and see the impact of applying the long-short strategy.
Strategy
There are other setups including:
1. Platform
2. Universe selection
- Rank all the stocks by
DollarVolume - Choose stocks that are in NASDAQ and NYSE
- Filter out the stocks that are listed less than 180 days (3 months)
- Filter out the companies whose market capitalization are less than 500 million dollars
3. Rebalancing strategy
- For the long-only strategy scenario, we buy 20 stocks that are most likely to rise.
- For the long-short strategy scenario, we long 20 stocks that are most likely to rise and short 20 stocks that are most likely to drop.
- We assign even weight to each position.
- We don’t adjust the weight of the portfolio while we hold our positions.
4. Long/Short signal generation
We have all the details regarding how to trigger the long or short signals in this post here. For those who haven’t read this post, the critical details have been summarized below:
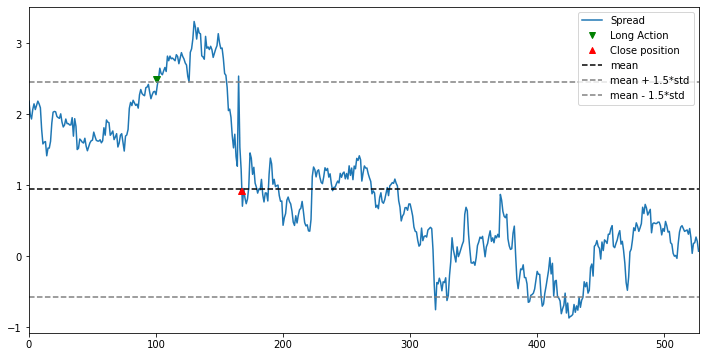
For basic distance, high variance, and zero-crossing methods, we use $\pm 1.5 \times std\ of\ spread$ as the upper bound and lower bound to trigger the buy/sell signals. Then we close the positions when the spread reverts back to the zero-line.
![]()
Open when above the upper bound and below the lower bound, and close when reverting back to the zero-line.
For the Pearson Correlation method, we construct a benchmark portfolio for each stock by picking the 50 most correlated stocks. We long the stocks that its stock price movement deviated from its benchmark portfolio movement, and spread of the stock movement is negative. Vice versa, we short the stocks that the spread of the stock movement is positive against the benchmark portfolio movement.
Backtest results
Backtest of basic distance
| LO-BD | LS-BD | Impact | |
|---|---|---|---|
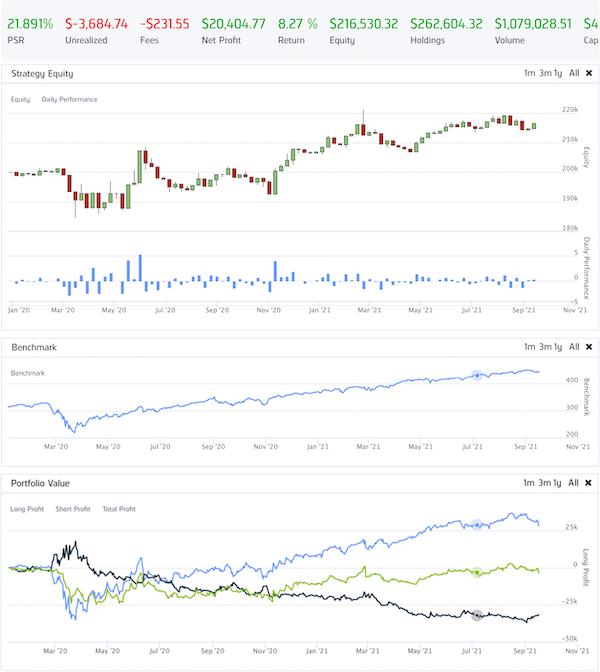
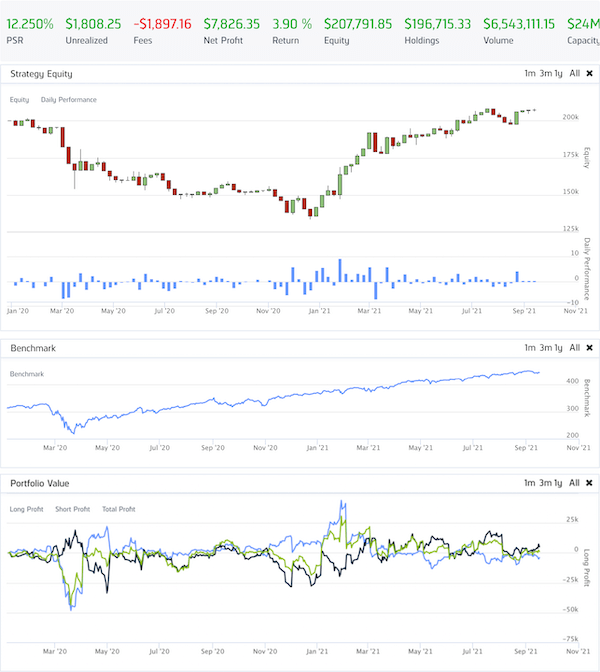
| Diagram | 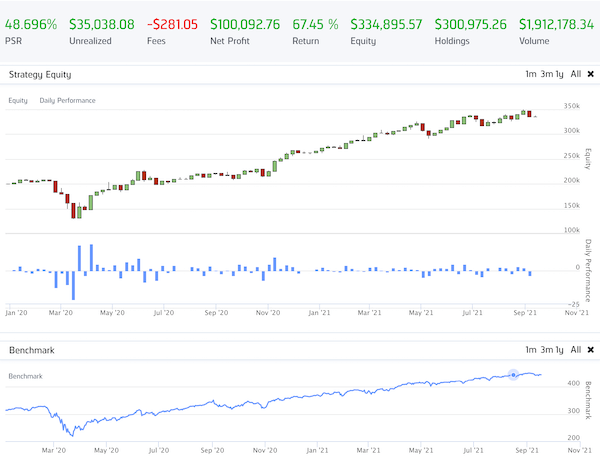 |
 |
|
| No. of trade | 172 | 428 | +256 |
| Return | 67.45% | 18.98% | -48.47% |
| Annual Return | 35.393% | 10.754% | -24.639% |
| Annual Standard Deviation | 0.304 | 0.134 | -0.17 |
| Max D.D. | 38.4% | 13.9% | -24.5% |
| Beta | -0.161 | 0.036 | |
| Alpha | 0.381 | 0.09 | -0.372 |
| Sharpe Ratio | 1.136 | 0.731 | -0.405 |
LO: Long-Only strategy, LS: Long-Short strategy, BD: Basic Distance
Backtest of zero crossing
| LO-ZC | LS-ZC | Impact | |
|---|---|---|---|
| Diagram | 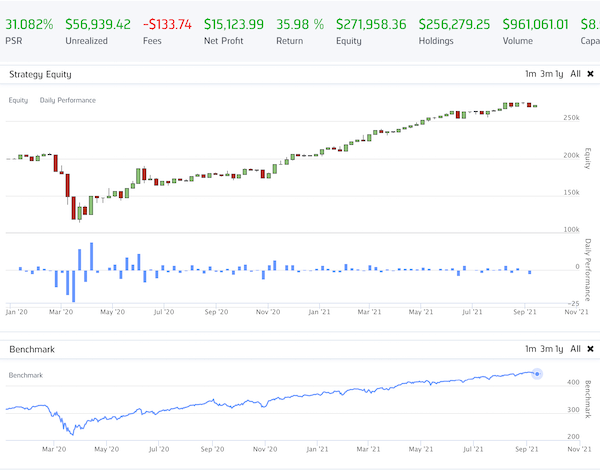 |
 |
|
| No. of trade | 102 | 216 | +114 |
| Return | 35.98% | 8.27% | -27.71% |
| Annual Return | 19.8% | 4.779% | -15.021% |
| Annual Standard Deviation | 0.303 | 0.093 | -0.21 |
| Max D.D. | 45.0% | 8.3% | -36.7% |
| Beta | -0.204 | 0.014 | |
| Alpha | 0.262 | 0.041 | -0.221 |
| Sharpe Ratio | 0.714 | 0.47 | -0.244 |
LO: Long-Only strategy, LS: Long-Short strategy, ZC: Zero Crossing
Backtest of high variance
| LO-HV | LS-HV | Impact | |
|---|---|---|---|
| Diagram | 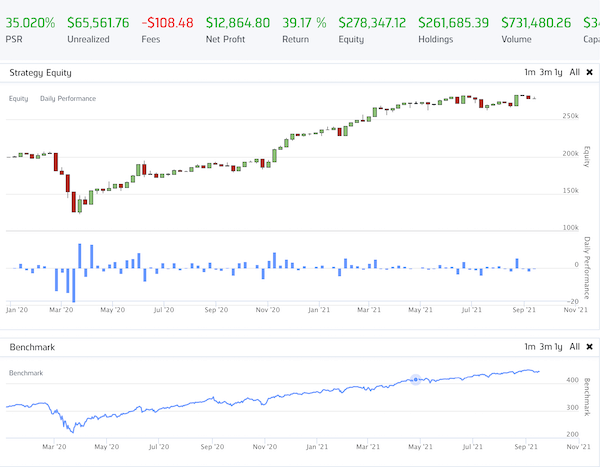 |
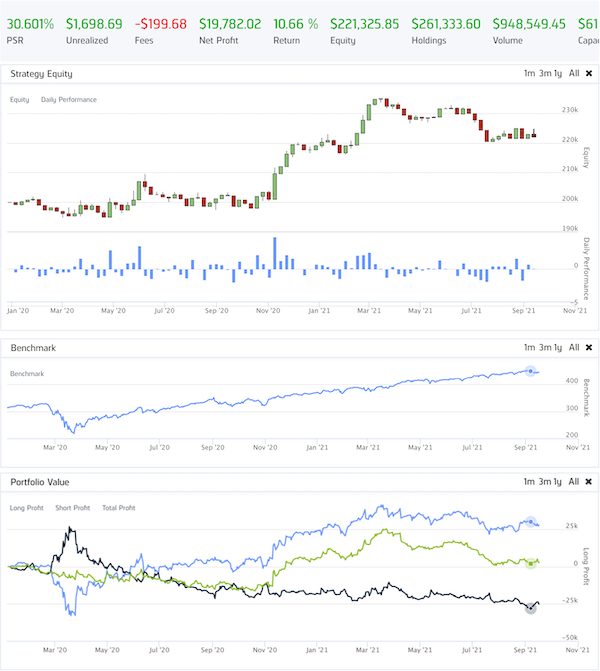 |
|
| No. of trade | 75 | 186 | +111 |
| Return | 39.1% | 10.66% | -28.44% |
| Annual Return | 21.446% | 6.136% | -15.31% |
| Annual Standard Deviation | 0.27 | 0.079 | -0.191 |
| Max D.D. | 41.00% | 6.200% | -34.80% |
| Beta | -0.143 | 0.037 | |
| Alpha | 0.25 | 0.046 | -0.204 |
| Sharpe Ratio | 0.806 | 0.677 | -0.129 |
LO: Long-Only strategy, LS: Long-Short strategy, HV: High Variance
Backtest of Pearson Correlation
| LO-PC | LS-PC | Impact | |
|---|---|---|---|
| Diagram | 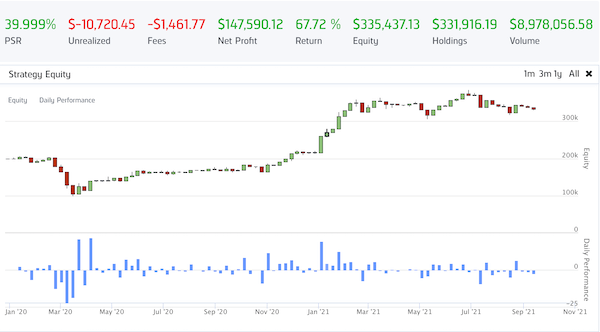 |
 |
|
| No. of trade | 72 | 1438 | +1366 |
| Return | 67.72% | 3.9% | -63.82% |
| Annual Return | 35.522% | 2.272% | -33.25% |
| Annual Standard Deviation | 0.406 | 0.197 | -0.209 |
| Max D.D. | 52.200% | 33.90% | -18.30% |
| Beta | -0.174 | -0.015 | +0.159 |
| Alpha | 0.435 | 0.042 | -0.393 |
| Sharpe Ratio | 0.975 | 0.196 | -0.779 |
LO: Long-Only strategy, LS: Long-Short strategy, PC: Pearson Correlation
Summaries
It’s quite clear to notice the impact after applying the long-short strategy. There are a few insights that we can extract from this series of backtests:
| Summarized details | |
|---|---|
| Pros | 1. As you short stocks while applying this strategy, you’re actually gaining and preserving more cash for your available cash pool. 2. The volatility KPIs, such as annual standard deviation and max dropdown, are drastically decreased by a certain degree, making your portfolio less volatile. 3. Beta is the indicator of whether your portfolio is highly related to the entire market. Your portfolio will be influenced less by the market fluctuation when the beta is close to 0. After applying the long-short strategy, you can tell that the beta has reduced to one-tenth in every scenario. Compare to the traditional long-only strategy, the long-short strategy suffers less influence during the recession, therefore your portfolio could rebound faster than the long-only strategy. 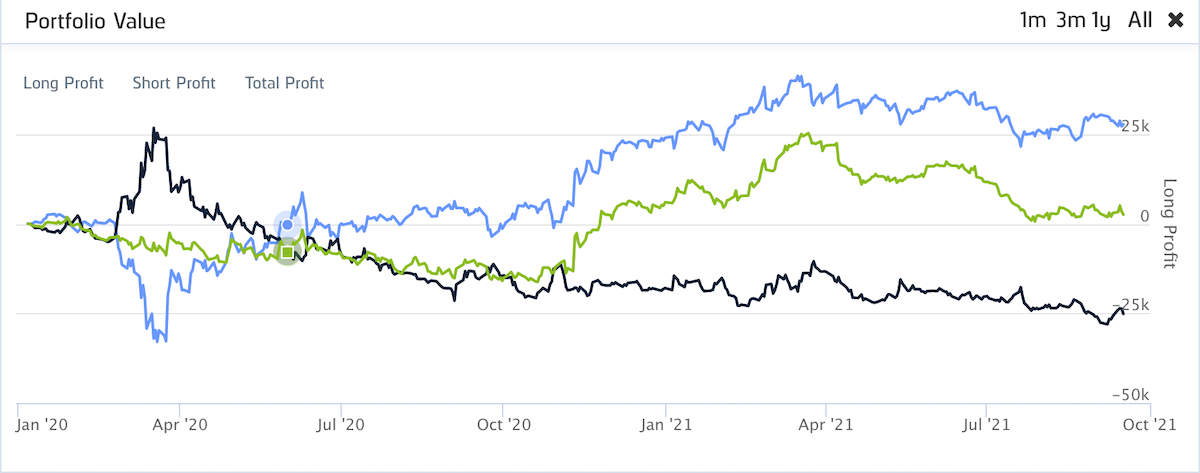 The opposite position would help hedge your losing positions, just like the dropdown happened in Apr. 2020 |
| Cons | 1. Despite it has the benefit of reducing the volatility of your portfolio, the long-short strategy would also hurt the return of your portfolio. 2. How do we evaluate whether applying the long-short strategy brings us more goods than harms or vice versa? We can take a look at the KPI Sharpe ratio. Sharpe ratio indicates the ratio between the risk-free return and the volatility. The decrease in Sharpe ratios in all scenarios does tell us that the long-short strategy takes away more return that can’t be compensated by the ability to withstand the volatility it adds. 3. As you can see in the previous backtest, that the number of transactions increased substantially afterwards in any scenario. The transactional cost of applying this strategy would increase compared to the traditional long-only strategy. |
What are the advanced strategies that we can explore?
Ummmm…. It seems like the results we have above don’t really gonna make us enough money to pay our rent. Even though the pair trading strategy that we developed above will help us reduce the volatility of our portfolio return, but the reduced return would really annoy us as this strategy makes us less money. So what are the things we can do in order to optimize this strategy and make it a money-making strategy? Here are a few other variations that we can explore:
Long-bias strategy
The long-bias strategy would require holding 130% long positions of invested capital and 30% short positions, achieving 100% net in long positions. The benefit of this strategy is that you could obtain more capital (30% more cash from the short position, plus the original 100% capital) to leverage compared to the traditional long-only strategy, which can only leverage 100% of their capital.
Market neutral strategy
Market neutral strategy refers to a type of investment strategy where the investor aims to profit from both an increase and a decrease in paired stock prices. This strategy features zero $\beta$, which makes the portfolio return won’t be impacted by the market fluctuation by hedging the systematic risk.
The benefits of adopting this strategy are pretty similar to the observation we have above, that applying market neutral strategy will make our portfolio more resilient in combating the economic storm.
Dollar neutral strategy
Similar to market neutral strategy, dollar neutral strategy targets to long the same dollar amount in positions and to short the same dollar amount in positions, rendering leveraging a very little portion of your available cash. The benefit being, you can leverage your positive and negative insights to maximize your portfolio value with very little money needed to be invested.
Final words
From the performed backtest, we get to know the outcomes of applying long-short strategies and how it impacts your portfolio performance. Long-short strategies and pair trading strategies are never a strategy that can bring you outstanding returns to brag about. However, it is a strategy that can become a gold mine that brings you money slowly and steadily over the long run.
Appendix
Reference
- What is Market Neutral?
- Long-Short Equity by Investopedia
- Multiple hedge fund strategies
- Market Neutral
- Market-Neutral Strategies: An All-Weather Investment Option
- 130/30 Funds: What is Behind the Commercial Offensive?
Attached backtest summarized report
| Scenario | No. of trade | Return | Annual Return | Annual Standard Deviation | Max DD | Beta | Alpha | Sharpe Ratio |
|---|---|---|---|---|---|---|---|---|
| LO-BD | 172 | 67.45% | 35.393% | 0.304 | 38.4% | -0.161 | 0.381 | 1.136 |
| MN-BD | 428 | 18.98% | 10.754% | 0.134 | 13.900% | 0.036 | 0.09 | 0.731 |
| LO-ZC | 102 | 35.98% | 19.8% | 0.303 | 45.00% | -0.204 | 0.262 | 0.714 |
| MN-ZC | 216 | 8.27% | 4.779% | 0.093 | 8.3% | 0.014 | 0.041 | 0.47 |
| LO-HV | 75 | 39.17% | 21.446 | 0.27 | 41.00% | -0.143 | 0.25 | 0.806 |
| MN-HV | 186 | 10.66% | 6.136% | 0.079 | 6.200% | 0.037 | 0.046 | 0.677 |
| LO-PC | 752 | 67.72% | 35.522% | 0.406 | 52.200% | -0.174 | 0.435 | 0.975 |
| MN-PC | 1438 | 3.9% | 2.272% | 0.197 | 33.900% | -0.015 | 0.042 | 0.196 |
Do tell me if you feel like this post helped you to some extent or not


