
Pair trading is just like a man leashing a dog. They never apart too far away.
New Column started! In this new column, we’re going to start by introducing the idea and principle behind this famous strategy. In the later posts, we’ll do research using different famous methods in pair trading. Hopefully, we’ll cover the fundamental knowledge of pair trading as much as possible.
Pairs trading is among the most popular trading strategies in many markets. This particular strategy involves simultaneous taking two correlated assets in different directions, using one asset in the pair to hedge the risk of the other one. Essentially, it is a market-neutral strategy.
What is the pair strategy?
Imagine this, if there are two convenience stores (A & B) opened in one area. They import their ingredients from the same farm and sell the same meat product at the same price $10. Both stores are making a good profit. As the product price of both stores tracks closely to each other, it’s expected that there won’t be a big difference in prices.

Store A and store B
One day, the farm raises the price of the ingredient, causing the owner of store A to decide to raise the price to $12 to spread the cost to his customers. Unfortunately, the owner of store B was out of town so the price in store B stays at $10. According to our past experience, we expect the price difference to converge after the owner of store B comes back to town. As a clever consumer, what you should do to get benefits from this opportunity?
Should we buy more products from store B and store them in our warehouse at a cheaper price? Nah…. What if the farm again drops the price so that the product price would incline to drop as well. Our stock in the warehouse would be considered overpriced. The risk of taking either asset in one direction would be considered tremendous.
…
I believe as clever as you have already come up with the plan. We can buy the lower-priced product from store B, and sell it to the customers who want to buy the higher-priced product from store A. By doing that, there will be a $2 profit per trade. We treat the price in store A and the price in store B as a pair. Whenever a price difference expands to certain degree, we could leverage the same strategy to buy the cheap one and sell the other expensive one. This can be exploited over and over again as long as the relationship between the price in store A and the price in store B doesn’t go away.
And, that is the pair trading strategy.
History of pair strategy
Pair trading is a methodology and practice that derive from statistical arbitrage trading. It first appeared in the theory developed by Australian investor and hedge fund manager Alfred Winslow Jones in the 1950s. However, due to the nature of the pair trading strategy, these strategies were not made possible until the 1980s when computers gradually become popular.
In 1987, Morgan Stanley disclosed the fact that they have made over 50 million dollars on pair trading strategy. The money at that time was like 10 times more valuable than the same amount today. Therefore you could imagine the amount of money they have made with a single strategy. Even the details of this strategy were revealed over time, the pair strategy is still the most popular market-neutral strategy these days.
I learn from here that pair strategy has been identified as the trading strategy used by Jim Simons), the most successful and smart hedge fund manager. He has publicly stated that the strategy his hedge fund adopting is contrarian: often buying stocks (that) recently out of favor, and selling those recently in favor.
The Founder and President of Renaissance Technologies had to say publicly in Congressional testimony
The principle of pair trading
Even though with all these talks and examples to explain what pair trading is, the principle of the pair trading is actually surprisingly simple. First we need to find out the right pair that the price movements of two assets follow a pattern. Let’s take the stock pair KEY-RF for example.
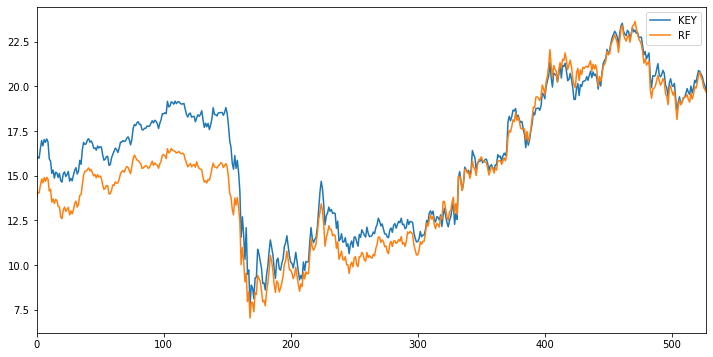
The correlation between KEY and RF is fairly high
The price movements of KeyCorp(KEY) and Regions Financial Corporation(RF) are very similar. But how similar they are? One way to do it is to check the price difference between their prices, which is called the spread. Therefore in the second step, we create a diagram of the spread to monitor the historic spread movement. To better understand the movement of spread, we marked the mean of the spread with the black dotted line, marked the threshold mean + 1.5 * STD and mean - 1.5 * STD to denote the area above and under the threshold are anomalies. As long as the spread breaks through the upper threshold, then we consider this a long signal. Once the movement drops to the mean of the spread, we consider the movement has restored to the normal level, so close the related positions.
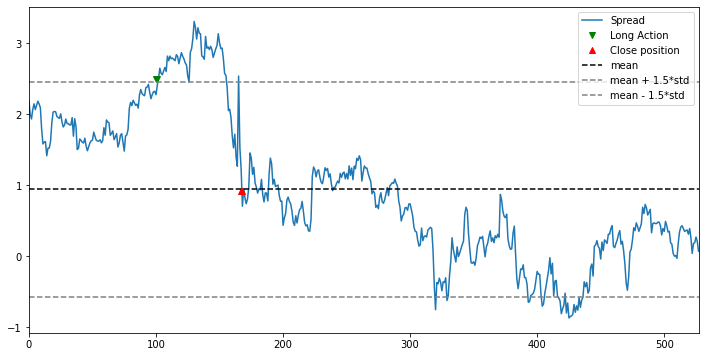
The price spread between `KEY` and `RF`, and the green triangle denotes the long signal.
The last rule we need to follow is, we long the cheaper asset and short the more expensive asset in the pair. Again taking the KEY-RF pair for example, if we follow the trigger generated in the above diagram, we gain $\$19 - \$9 = \$10.0$ from the KEY we short, and we lost $\$15.8 - \$8 = \$7.8$ from the RF we long. Combining the P&L of these paired assets, we actually earned $\$10.0 - \$7.8 = \$2.2$ in this trade. In short, the profit earned from the pair trading strategy is not from the movement of the stock’s intrinsic value, but from the anticipation of the shrinkage of the price spread.
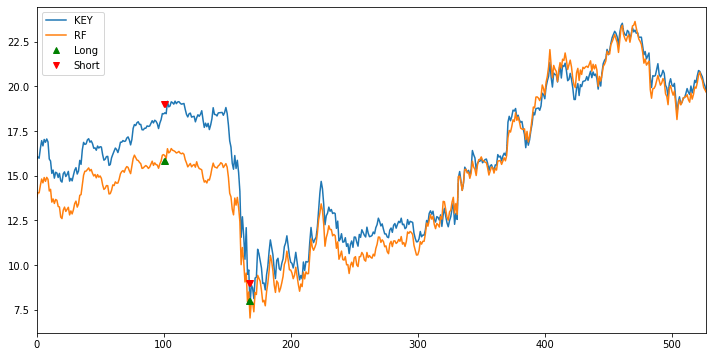
KEY has recovered more return than what RF lost
To summarize everything in very simple words, there are only three steps to implement and execute the pair trading strategy:
- Find the target paired assets and how they are correlated
- Monitor the movement to see when to generate the trading signals
- Long the cheaper and short the more expensive when we see the trading signals.
How to find the pair that works?
So it all comes down to the question of how to find the right pair to trade. If two assets in your selected pair are not correlated or if they are correlated but the spread will not converge, then they are not the right pair to trade. Here are three methods you can use to try finding the right pair.
According to business models
We can choose two assets that are similar in their business model because they are suffering the same environmental risk, business risk, infrastructure risk, …, as well as external opportunities. As a result, their price movement has the inclination to move in the same direction with the same magnitude. A potentially good pair could be UBER v.s. LYFT, or CCL v.s. RCL.
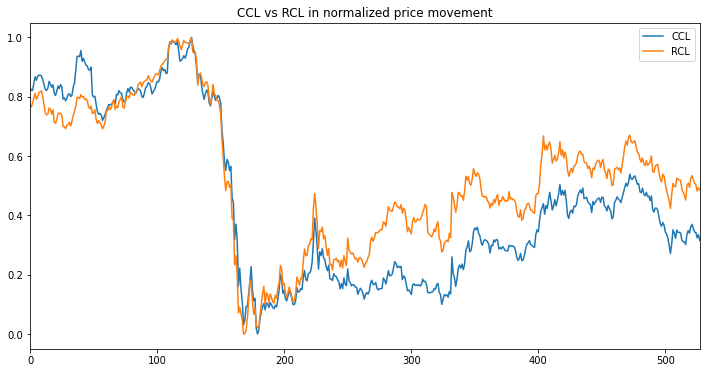
CCL vs RCL in normalized price movement
According to the professional knowledge
As the business models are the public information that is accessed by you and tens of thousands of people/institutions, the profit generated from this type of trading pair can fade away very quickly as so many parties are exploiting the same opportunity. To gain an edge competing with others, you need to study and work harder to keep yourself from competing with others in the red ocean.
If you understand the business models in a bigger picture, you can put all the small pieces of information together to solve the puzzles. For example, you get to learn that company B is the sole supplier of company A. So if company A makes a good profit in the fiscal year, then you can expect company B will make a good profits as well. If not, there might be a chance for arbitrages. Or, if you find out that an ETF was tracking with a stock index like S&P 500, you can trade when the spread between the ETF and the index expends and close this trade when the spread converges. You can spot more and more opportunities like this when you understand the assets or the market more,
According to the pair correlation and cointegration
This method is more of a mathematical way to find the right pair of assets. This post is already long enough, so you can check out this Quora thread before we get to this topic in the following post.
Pair trading methods
Christopher Krauss has summarized various pair trading methods in his dissertation on Statistical arbitrage pairs trading strategies. The methods are:
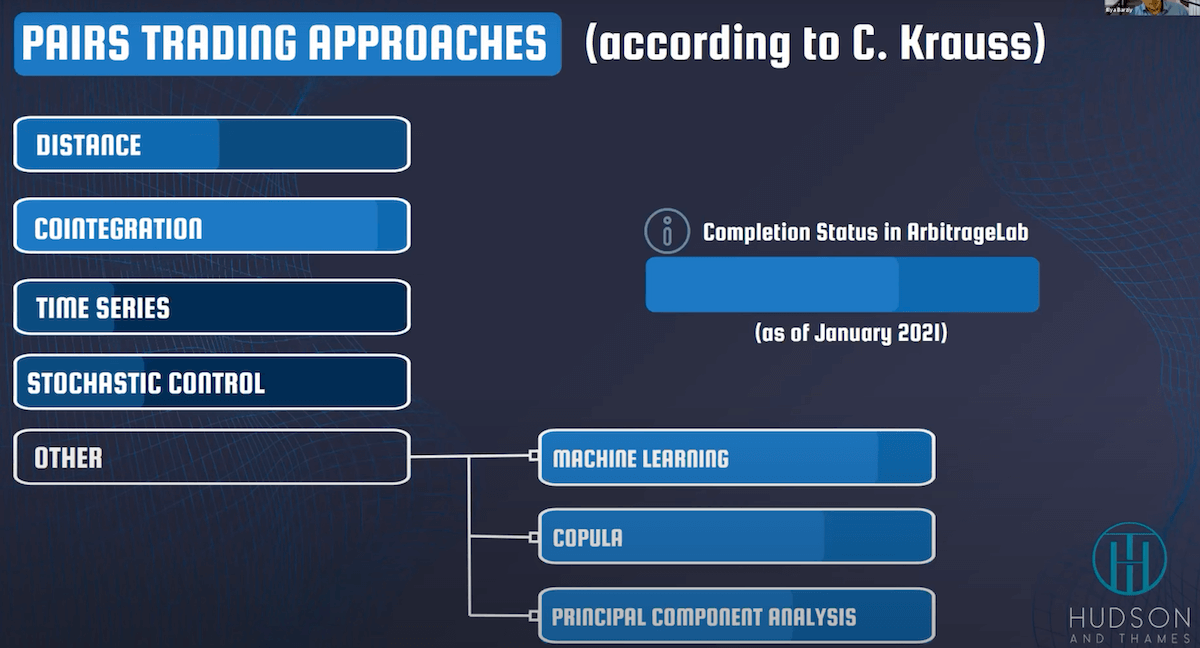
Extracted from Pairs Trading: The Distance Approach by Hudson & Thames
We will cover these methods one by one in the following series.
Pair trading resources
- Hudson & Thames
- It’s a research institution that puts a lot of effort into working on pair trading strategies. It also has a dedicated python library for people who are interested in working with pair trading strategies. Check out their blog here for more articles related to what they are doing.
- Pair Trading Finder is a blog that publishes its research regularly. Other than telling you their latest research results, they even share the best pair of stocks of the month to be traded.
In the next post, we’ll start looking at how to build our first pair trading strategy using the distance approach.


