In the post How to save your silver bullets with MACD strategy?, we have backtested the strategy of MACD and the other six different momentum indicators. In the end, the combination of MACD and the awesome oscillator is the better and seemingly profitable one among all six combinations. But, we won’t stop right there. In order to raise our portfolio win rate and return, we will discuss a few variants of MACD and Awesome Oscillator to derive different buy and sell signals.
Objective
How to calculate the MACD and awesome oscillator and the others have been introduced in How to save your silver bullets with MACD strategy?, so we’re skipping all the entry-level knowledge. Instead, we’re going to touch on how to utilize the generated indicators to put together the strategies that are profitable.
I have found three different ways to generate MACD trading signals and four to generate awesome oscillator trading signals. Therefore, we will conduct $3 * 4 = 12$ backtest to see which combination would bring us more profits.
About the trading strategy
Platform
As said in the previous post, Quantopian has already retired from the market. So I need to migrate the original trading script from Quantopian to QuantConnect. To know more details about QuantConnect, you can check out the post Step up your game in Quant trading - Backtest platforms QuantConnect v.s. Quantopian review
Universe
Universe stands for a group of specific securities that are traded in the market. We are not going to put all the tradable securities in our basket because:
- Save memory and time while running our trading script.
- Not all securities in the market work well with the momentum strategy.
- Remove market noise by selecting the best fitting securities and put them into our universe.
Universe could help you focus on the securities that best-fit your strategy
So picking our universe would be an essential step to avoid decidophobia in selecting the numerous securities in the market.
Here my assumption is that the securities in the technology sector would be influenced by the momentum factor the most. So we’re picking the technology stocks and sort them by pbRatio, EPS, ROE.
Prepping MACD and Awesome Oscillator indicators
We are using the traditional MACD and awesome oscillator setup and no additional twist.
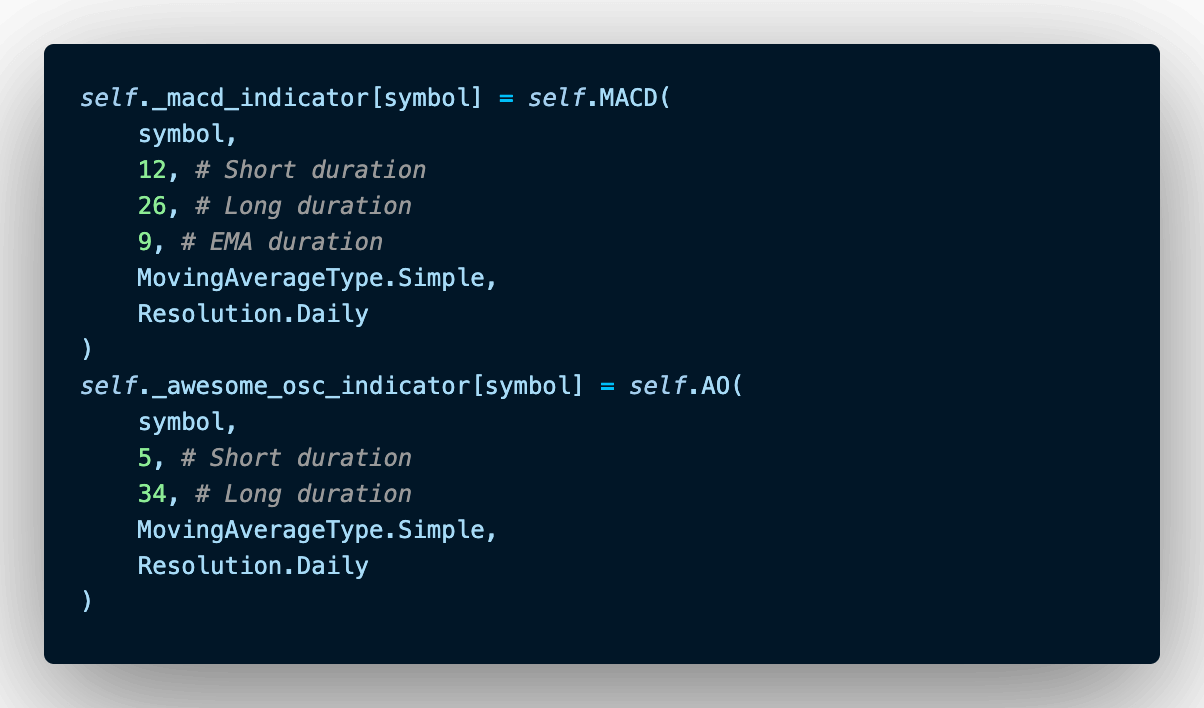
MACD and Awesome Oscillator indicators setup
MACD and Awesome Oscillator signals
To follow the mindset of our previous strategy setup, we need both MACD and awesome oscillator trading signals to be true in order to trigger buy or sell actions. Here we extend our strategy and use three different ways to generate trading signals using MACD indicators:
I. Simple MACD: We set our MACD trading signal to
Truewhen MACD is greater than 0, and toFalsewhen MACD is lower than 0.
By the definition of Talib python package, MACD indicates $EMA{short\ term} - EMA{long\ term}$. So the True trading signal essentially telling you that the target stock price rising speed is faster than before.
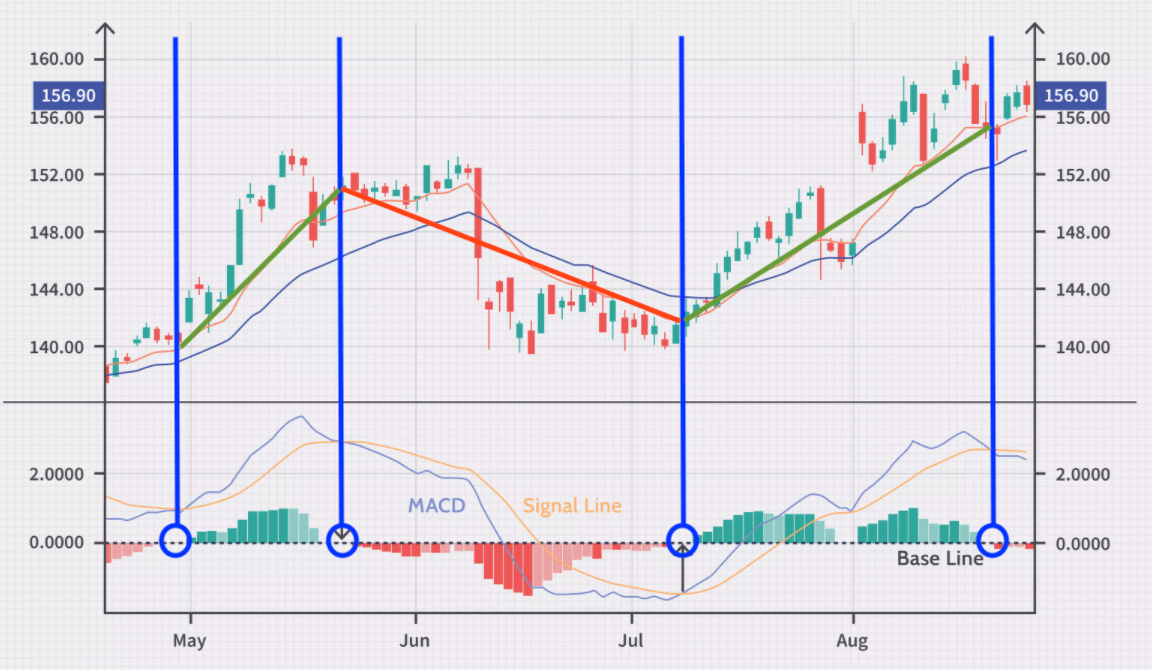
II. Signal MACD: We set our MACD trading signal to
Truewhen our MACD signal is over MACD, and set toFalsewhen MACD signal is below MACD.
MACD signal passing above MACD shows the start of the up-trending momentum.
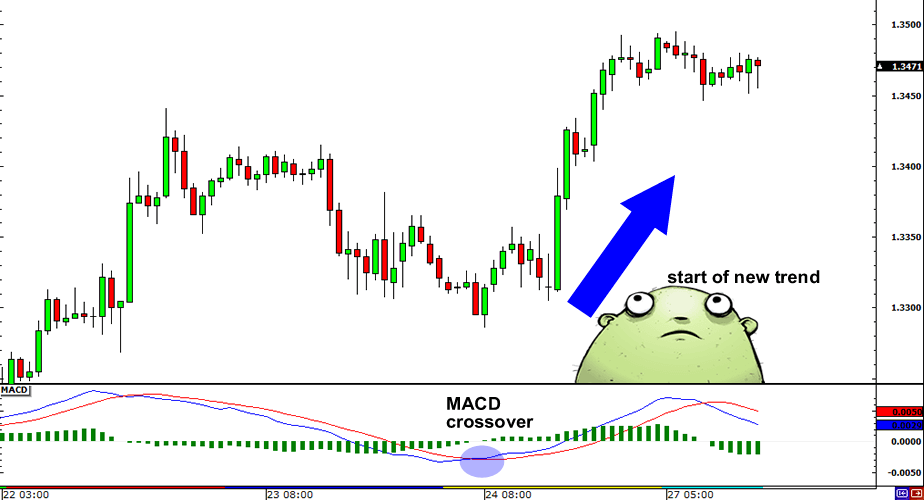
III. Historic MACD: Set MACD trading signal to
Truewhen Hist[n] > 0 and Hist[n-1] < 0 and Hist[n-2] < 0, while n is the current date.
This strategy is meant to capture the scenarios when the momentum is about to revert. So we are going to buy when the MACD histogram bar turns from red to green, and to sell when the bar turns from green to red in order to capture the movement between peak and bottom. See the below illustration for the exact trading timing.
MACD histogram stands for the beginning of a upward/downward trend
In the meantime, there are four different ways to generate trading signals using awesome indicators:
I. Simple AO: We set our AO trading signal to
Truewhen the value of AO is greater than 0.
By the definition of the AO indicator, we will execute the buy and sell action only when
, which shows a strong up/down trending momentum in the recent five days.
II. Historic AO: We set our AO trading signal to
Truewhen AO[n-2], AO[n-1] < 0, AO[n] > 0 where n is the current date.
The disadvantage of the previous method is that we couldn’t judge whether the signal was triggered at the beginning or at the end of the up-trend. To be able to do that, we can add a queue to store the AO values of the previous day. So we can advance our strategy to Turn green light when we have a green bar after we received two consecutive red bars.
III. AO Saucer
This is a traditional AO strategy. We set our buy signal to True when the AO is above the zero-line and the AO histogram having two consecutive red bars where the second red bar is smaller than the first red one and the third bar of the histogram is green. On the contrary, we’ll launch a sell signal when the opposite signals were triggered.
IV. Lame Oscillator
This is an alternative AO strategy that I found in this post. The Lame Oscillator is the mirror view image of the Awesome Oscillator, where
And with go long (buy) whenever the bars change to green, you actually turning a momentum indicator (awesome oscillator) into a mean-reversion indicator (lame oscillator).
Backtest setup
Duration
We started our backtest from 2020/01/03 to 2021/06/30.
During this backtest period, there are events that caused the market to be very volatile, such as:
- COVID-19 caused the market to plummet at the beginning of 2020
- US oil prices turned negative for the first time in history on April 20th, 2020.
- Tesla stock price rocket high since added into S&P 500 on Dec 21st, 2020.
- Nasdaq and S&P 500 to record high on June 22nd, 2021.
This process of gradually recovering from the great landslide is an excellent case to validate whether our portfolio outgrows the other securities.
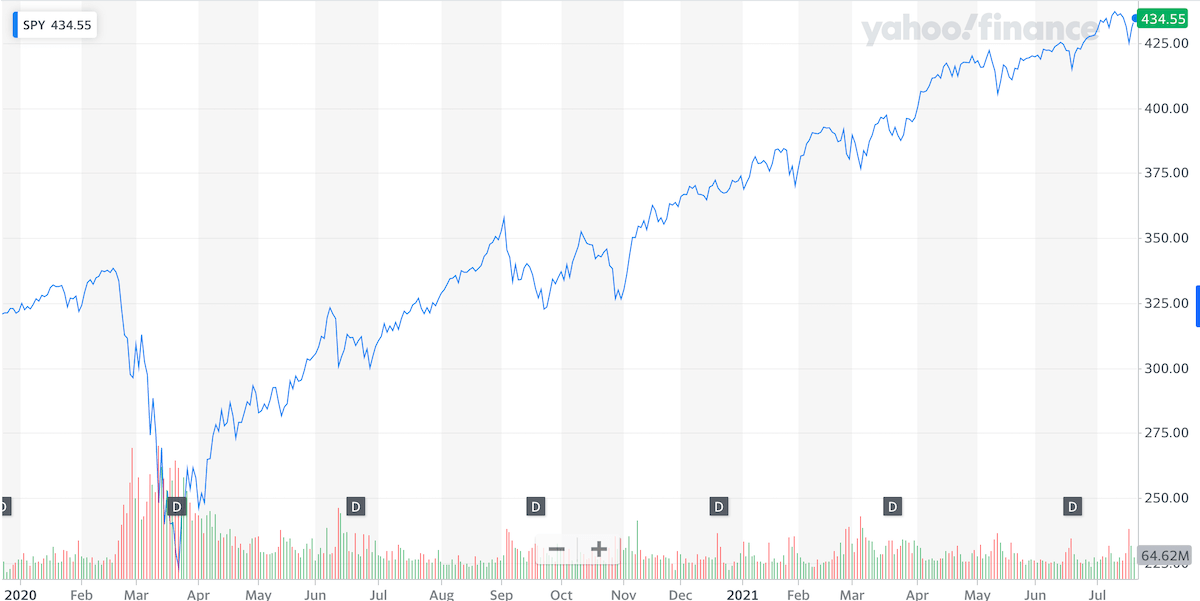
SPY benchmark return from 2020/01/03 to 2021/06/30
Capacity
The maximum number of positions in our portfolio is 20. This is a number that I feel comfortable with and enough to diversify the risk. Also keeping the capacity at 20 won’t generate too much transaction cost to reduce our profit earned.
Benchmark equity
SPDR S&P 500 (SPY)
Performance
As instructed in How to save your silver bullets with MACD strategy?, we combined our MACD indicator with secondary indicator, awesome indicator, and place buy/sell order only when both signals are True. By having three types of MACD trading signals and four types of awesome oscillator trading signals, we’re going to conduct backtest against each combination in order to find valuable insights:
| No. | MACD | AO | PSR | Unrealized | Fee | Net profit | Return | Total Trades | Sharpe | Average Win | Average Loss | Compounding annual return | Profit-loss ratio | Win rate | Alpha | Beta | Annual STD | Information ratio | Treynor ratio |
|---|---|---|---|---|---|---|---|---|---|---|---|---|---|---|---|---|---|---|---|
| 1 | simple | simple | 63.632% | 12580.06 | -901.77 | 66572.85 | 78.28% | 386 | 1.53 | 0.57% | -0.42% | 47.336% | 1.34 | 71% | 0.479 | -0.194 | 0.284 | 0.505 | -2.246 |
| 2 | simple | history | 34.555$ | 5468.21 | -602.82 | 81386.32 | 86.30% | 235 | 1.024 | 1.09% | -0.62% | 51.747% | 1.76 | 71% | 0.75 | -0.141 | 0.702 | 0.65 | -5.101 |
| 3 | simple | saucer | 85.070% | 77031.19 | -67.35 | 10746.71 | 87.77% | 30 | 2.152 | 2.66% | -0.28% | 52.547% | 9.68 | 80% | 0.457 | -0.037 | 0.208 | 0.659 | -12.102 |
| 4 | simple | lame | 77.616% | 89100.19 | -626.11 | 34429.91 | 122.96% | 310 | 2.038 | 1.10% | -0.55% | 71.163% | 1.98 | 46% | 0.667 | -0.133 | 0.313 | 0.966 | -4.8 |
| 5 | signal | simple | 62.294% | 2891.42 | -1552.71 | 81655.38 | 77.26% | 784 | 1.504 | 0.39% | -0.55% | 46.771% | 0.72 | 75% | 0.474 | -0.192 | 0.287 | 0.494 | -2.247 |
| 6 | signal | history | 64.655% | 18826.02 | -865.60 | 80217.01 | 98.23% | 370 | 1.613 | 0.78% | -0.81% | 58.193% | 0.96 | 74% | 0.595 | -0.21 | 0.34 | 0.705 | -2.606 |
| 7 | signal | saucer | 58.717% | 9274.61 | -498.98 | 60188.65 | 69.03% | 210 | 1.386 | 0.93% | -1.01% | 42.165% | 0.92 | 78% | 0.427 | -0.152 | 0.283 | 0.41 | -2.588 |
| 8 | signal | lame | 45.533% | 3227.54 | -1648.22 | 45332.09 | 46.94% | 842 | 1.038 | 0.46% | -0.42% | 29.427% | 1.08 | 58% | 0.326 | -0.178 | 0.275 | 0.15 | -1.602 |
| 9 | history | simple | 61.309% | 2243.49 | -1079.29 | 69660.57 | 70.87% | 393 | 1.449 | 0.64% | -0.46% | 43.203% | 1.39 | 67% | 0.436 | -0.173 | 0.274 | 0.425 | -2.3 |
| 10 | history | history | 61.450% | 2289.94 | -1098.91 | 70060.83 | 71.30% | 336 | 1.453 | 0.64% | -0.45% | 43.442% | 1.41 | 67% | 0.438 | -0.173 | 0.275 | 0.429 | -2.307 |
| 11 | history | saucer | 90.552% | 83437.15 | -85.20 | 39405.77 | 122.79% | 34 | 2.53 | 4.46% | -1.29% | 71.079% | 3.46 | 89% | 0.616 | -0.057 | 0.238 | 1.044 | -10.545 |
| 12 | history | lame | 47.657% | 20467.80 | -164.71 | 31814.14 | 52.15% | 88 | 1.098 | 1.97% | -0.77% | 32.488% | 2.57 | 59% | 0.345 | -0.135 | 0.287 | 0.221 | -2.332 |
I believe it is a good practice to set up some baselines before starting to look at the line chart of our portfolio return over time. These basic guidelines stand for the limitations and capabilities of the strategy to our own knowledge. In our backtest results, we marked anomaly numbers from the summarized table above in RED color.
- First of all, we drop the backtests that have little
trades (number of transactions). Our strategy aims to capture the momentum between the buy signals and sell signals, so 30 trades generated in one and a half years doesn’t mean our strategy is ineffective. We simply wouldn’t be able to judge whether our strategy is consistently profitable over years with this little in samples. - The same logic applies to
Unrealized (return). We consider trades to be successful when we buy security, hold for a period, and then sell to close the position. Without closing the positions, we won’t be able to test the profit-taking ability of our strategy. Therefore we wouldn’t prefer these scenarios. - Other factors like the
winning rateand thetotal portfolio returnare also things for us to decide whether it’s a good strategy or not. Here we ruled out the strategies that have a low winning rate or total return.
Once we have our baselines in place, let’s summarize our comments in the below table.
| No. | MACD | AO | Diagram | Comment |
|---|---|---|---|---|
| 1 | simple | simple | 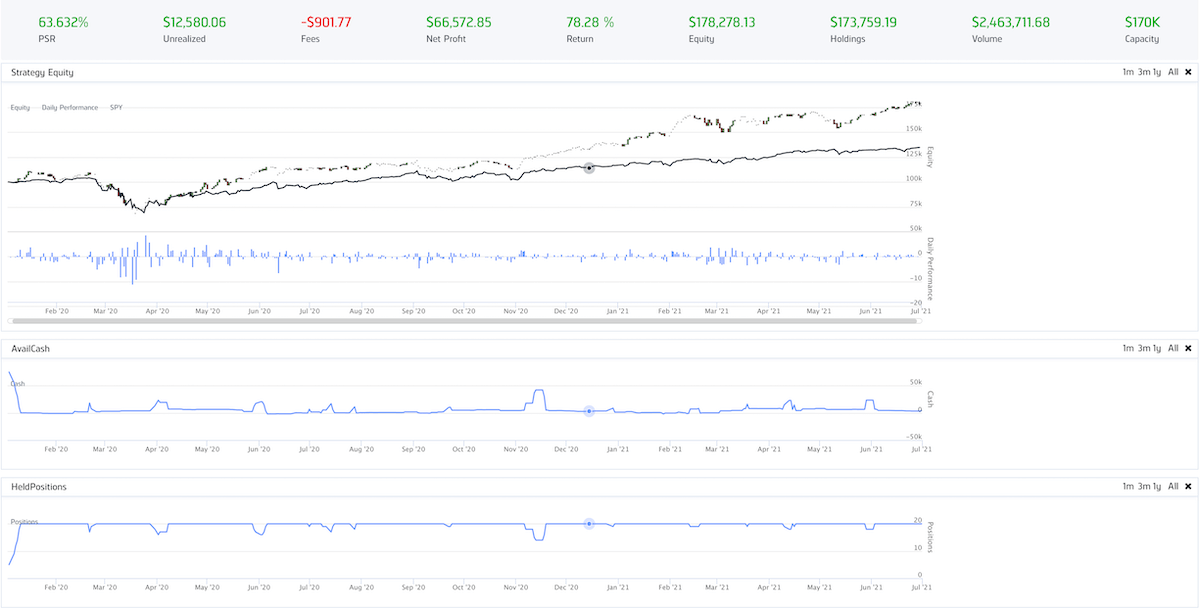 |
This is a great example of our desired strategy. Even though our total return plummets during the COVID-19 event, our portfolio managed to grow steadily and to grow in the spread between total return and the benchmark return. Compounding annual rate 47.336% is good enough to be a quant strategy to trade on daily basis. |
| 2 | simple | history | 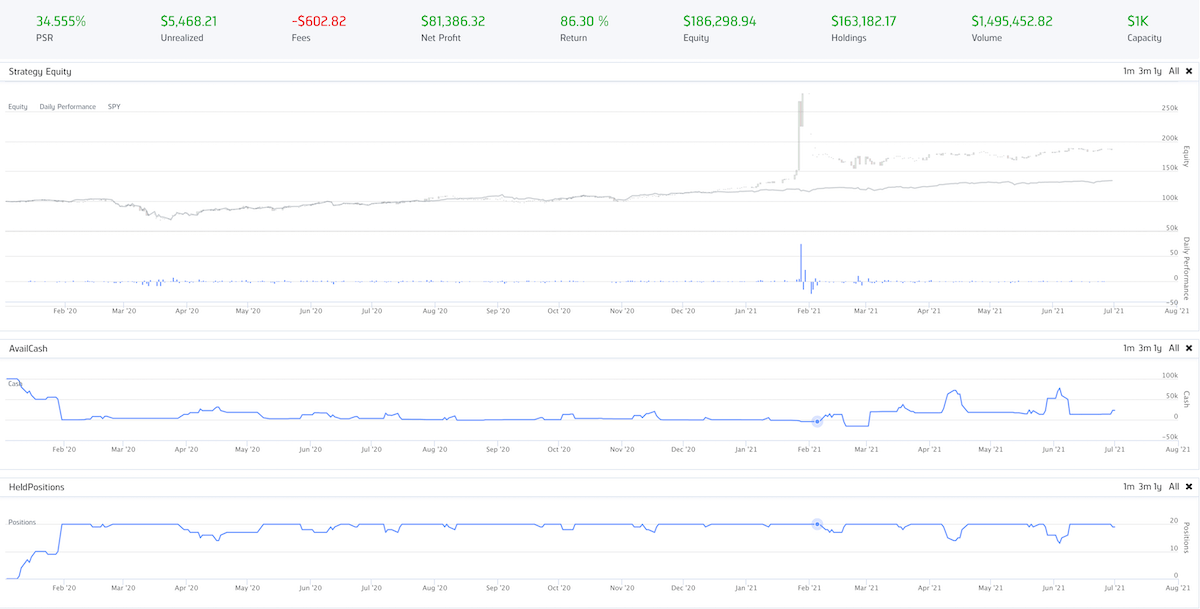 |
Even though we have an attractive portfolio return, you’ll notice that our portfolio return has no difference from the benchmark return the 90% of the time. Our only profit gain started in a spike in Feb 2021. As our aim is to find a strategy that can create consistent profit, I wouldn’t say this strategy is appropriate and meet our goal. |
| 3 | simple | saucer | 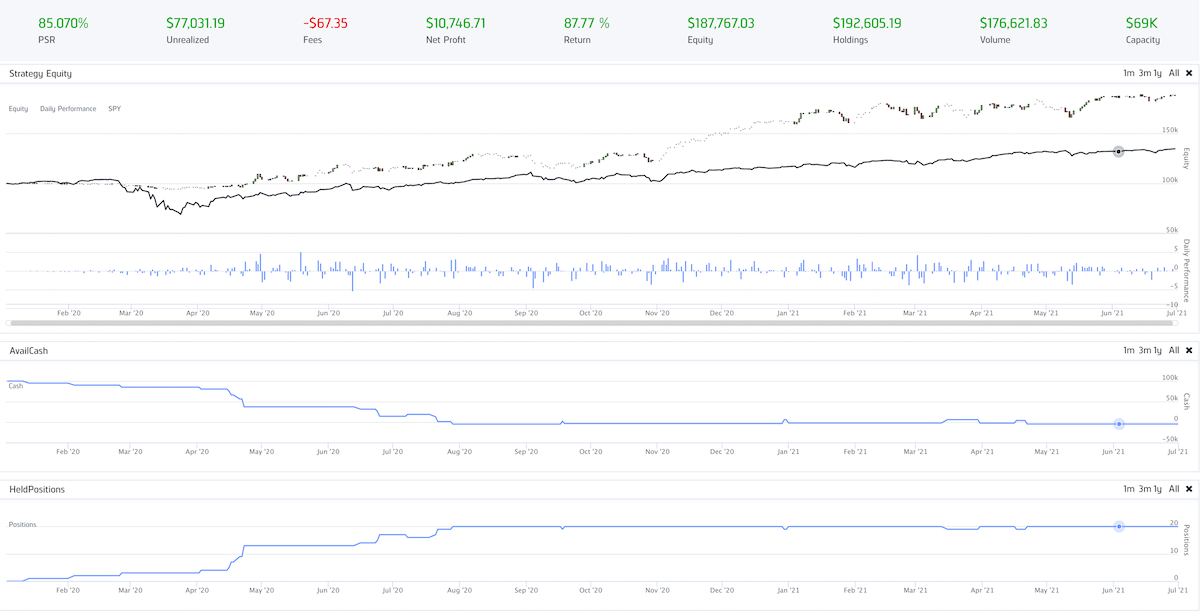 |
At first glance, this seems to be the perfect strategy as we don’t see a drastic drop during COVID-19, and the portfolio return outgrows steadily compared to benchmark return. However, this test scenario is against the guidelines that the number of trades is too little for us to confirm this signal as valid. |
| 4 | simple | lame | 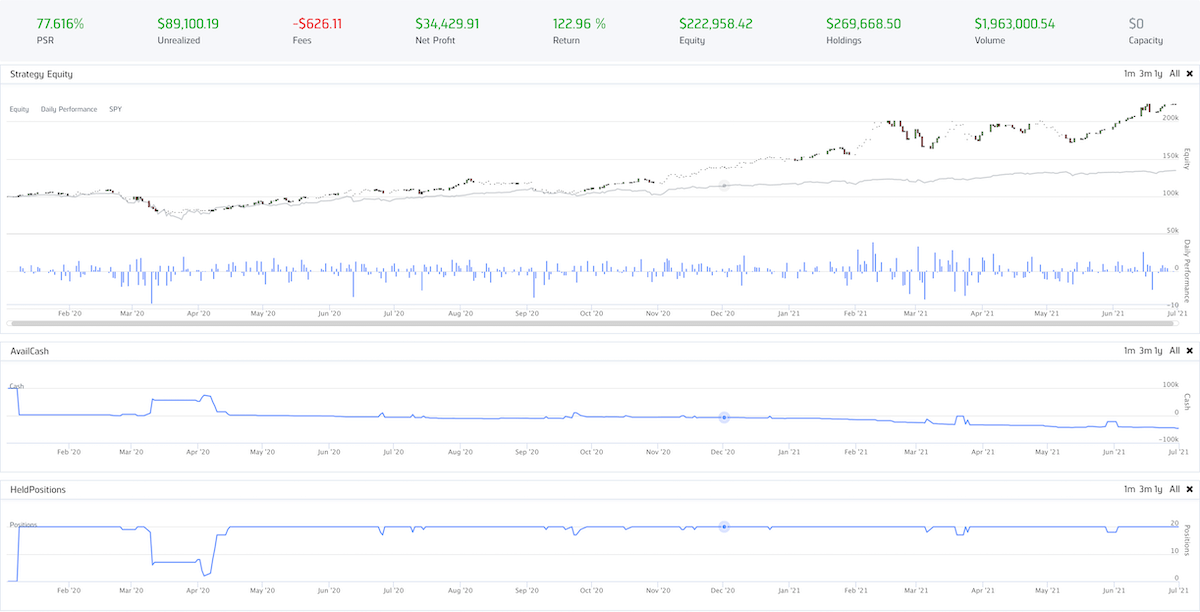 |
Apparently the Lame indicator would be able to help us locate the good-quality stock, but couldn’t close the position under our exit strategy. This would be a good strategy if we can improve the exit strategy of this scenario. |
| 5 | signal | simple | 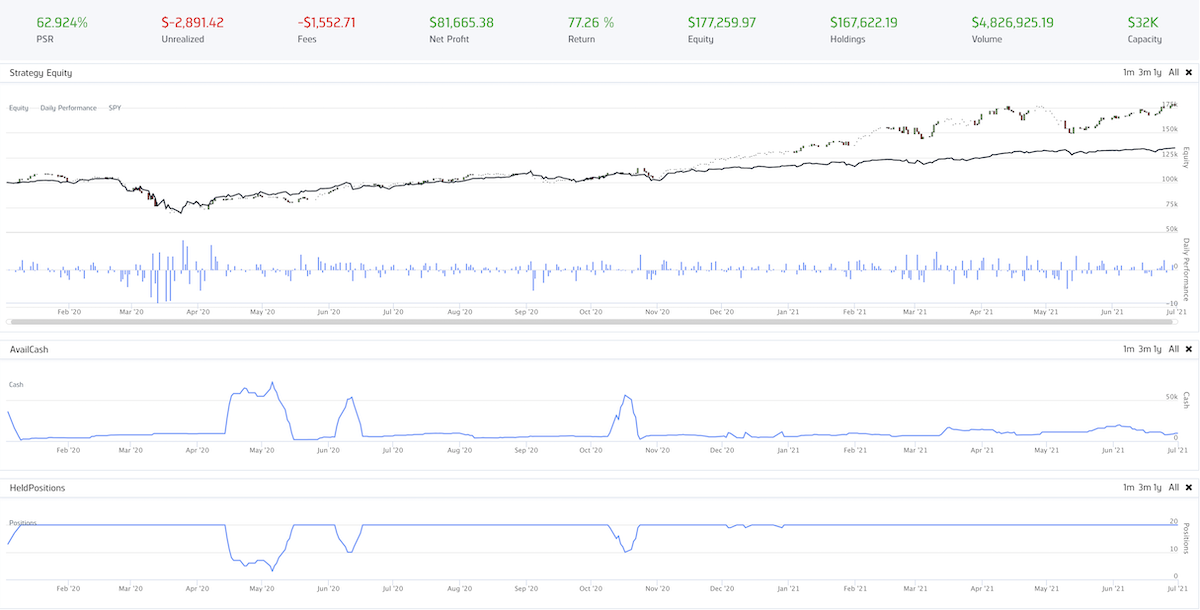 |
This strategy is not impressive as it took too long to recover from the pandemic collapse. |
| 6 | signal | history | 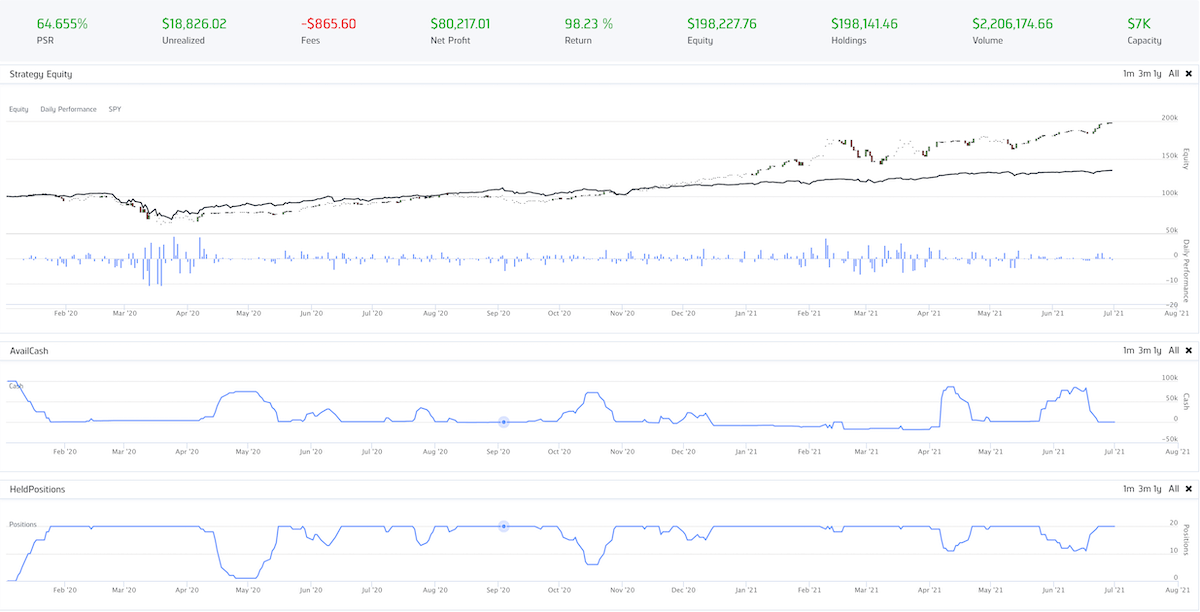 |
Same as above |
| 7 | signal | saucer | 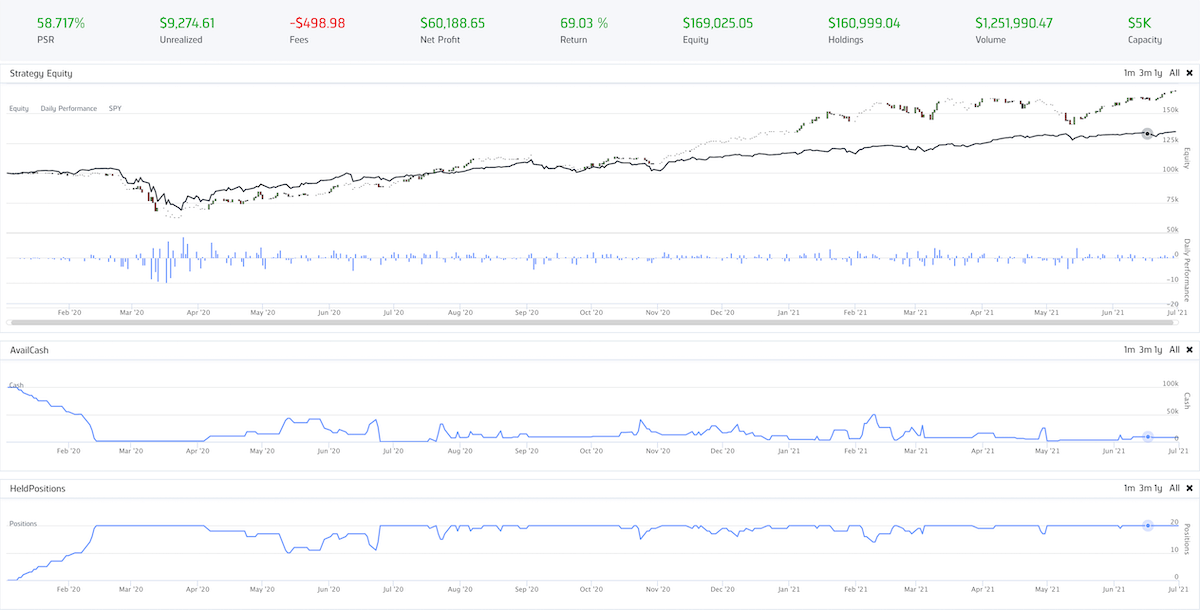 |
Same as above |
| 8 | signal | lame | 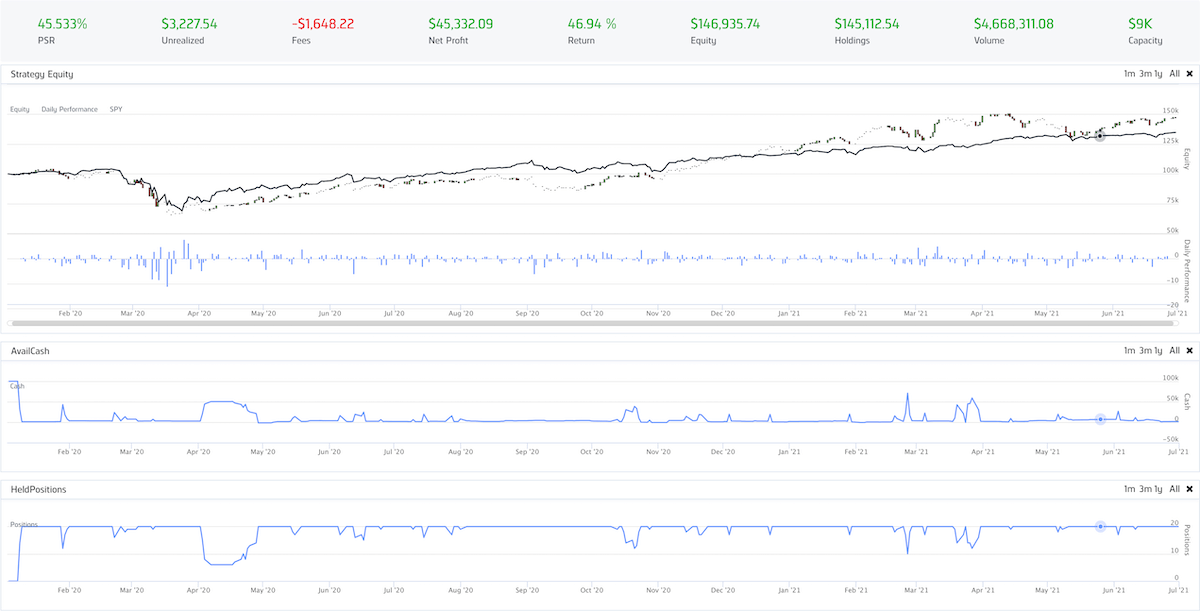 |
Same as above |
| 9 | history | simple | 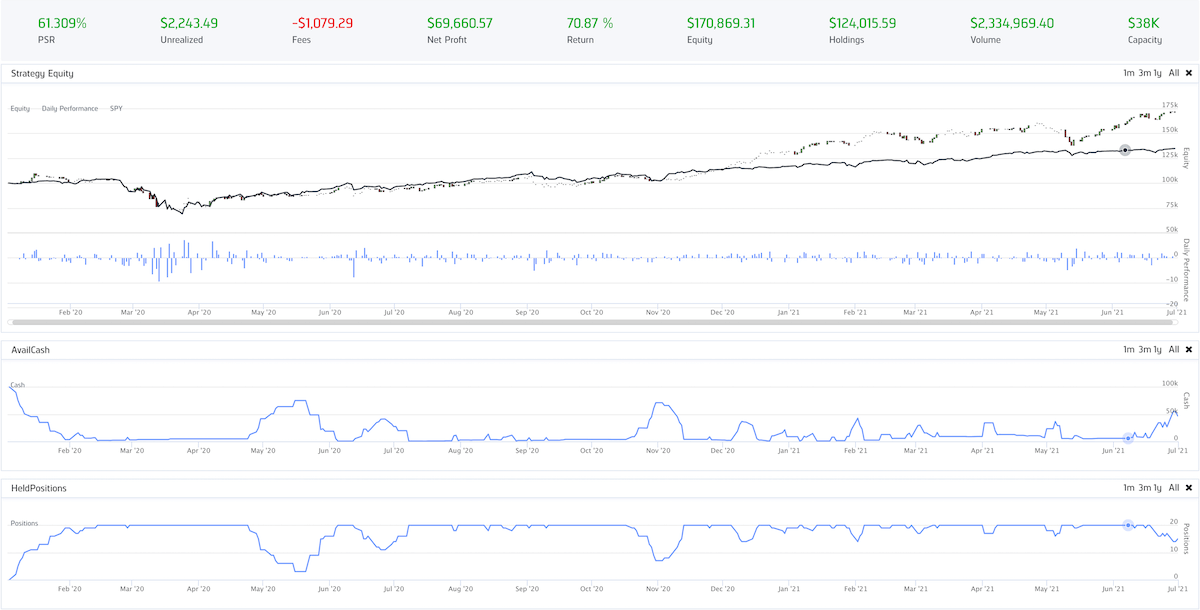 |
Same as the strategies in 5, 6, 7, 8, that this strategy took too long to surpass the benchmark return. |
| 10 | history | history | 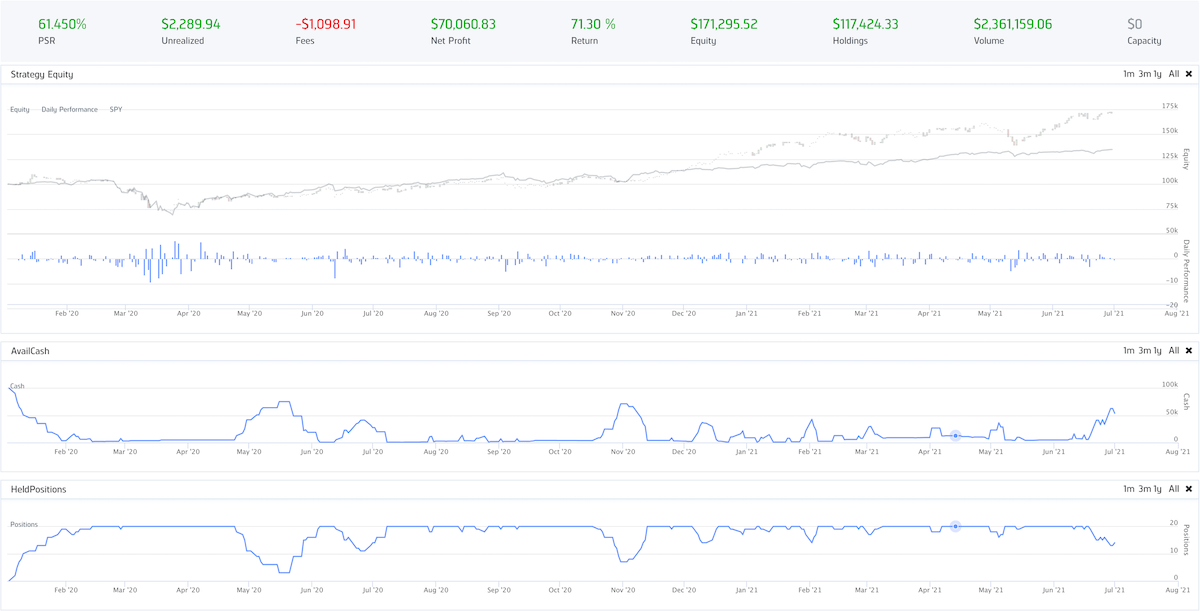 |
Same as the strategies in 5, 6, 7, 8, that this strategy took too long to surpass the benchmark return. |
| 11 | history | saucer | 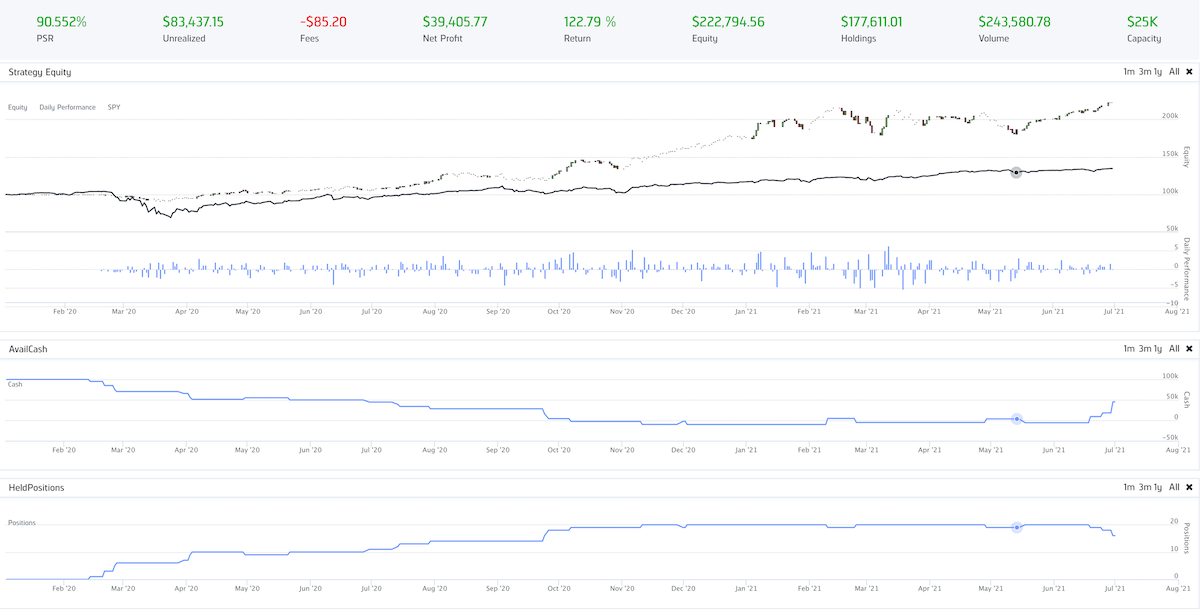 |
Same as scenario 3, the positions were built up too slowly as there were too few trading signals triggered. Could be a profitable strategy, but we need more signals and valid trades to justify whether this is a valid strategy. |
| 12 | history | lame | 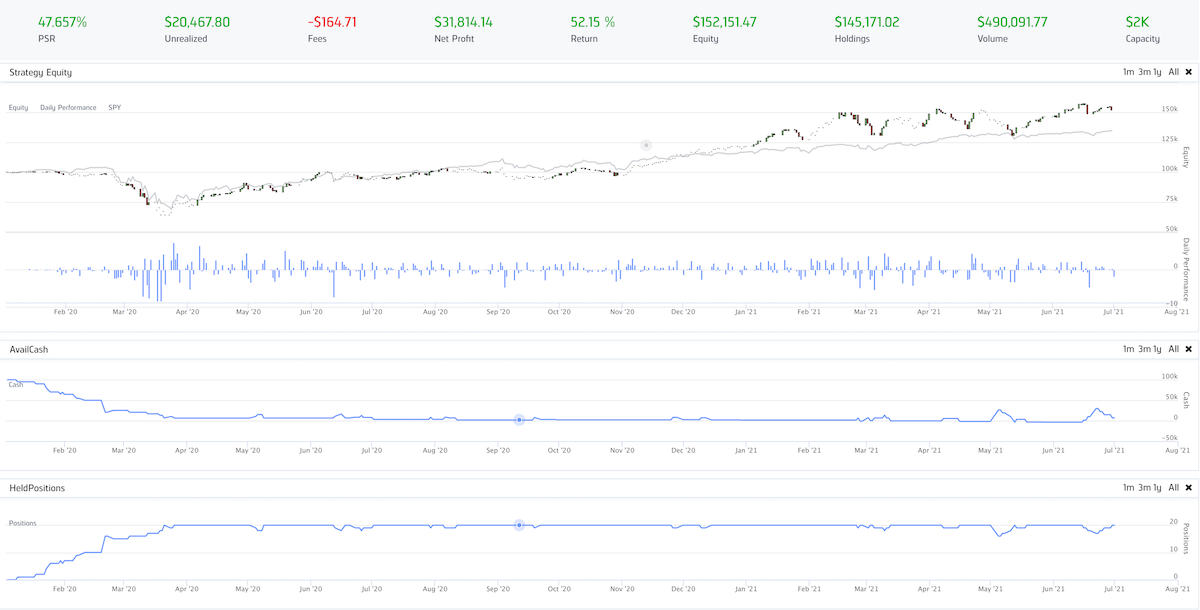 |
Same as the strategies in 5, 6, 7, 8, that this strategy took too long to surpass the benchmark return. |
Summary
Unfortunately, the new methods to generate trading signals didn’t really help to improve the quality of our MACD trading strategy. The Signal MACD and the Historic MACD based scenarios didn’t produce a better performance at all. So once again we can confirm that our original MACD strategy with Simple MACD and Simple AO is a good enough strategy for now. But in the meantime, we have discovered two more possible optional strategies with AO Saucer indicators in backtesting 3 and 11. As long as we can generate more samples, we can justify our backtest results to see whether these newly generated samples are still giving the edge to make a consistent profit.


