
Machine learning has been a black box for most people. We have been told how powerful it is to address our questions with the terms such as CNN, LSTM, training data, modeling, …. Also, machine learning has been practicing in so many fields such as medical, finance, macroeconomic, marketing, …etc to address the most difficult and complex questions.
Using machine learning as a tool to beat the market would be our goal here. Therefore, I’ve put together a list of questions that I used to have and will address them one by one in this post, hoping this would help people who have the same questions as I did. The fundamental ideas and theories behind machine learning are all about math, which I’m not going to over in this article as it would take ages to explain them in a better way than all the other existing articles that you can find on the internet.
The questions are:
- What does Machine learning do in the finance world?
- How does machine learning work?
- What are the FAMQ (Frequently Asked Myself Questions)?
- Postlogue: What is our ultimate goal of developing a quantitative investment strategy?
What does Machine learning do in the finance world?
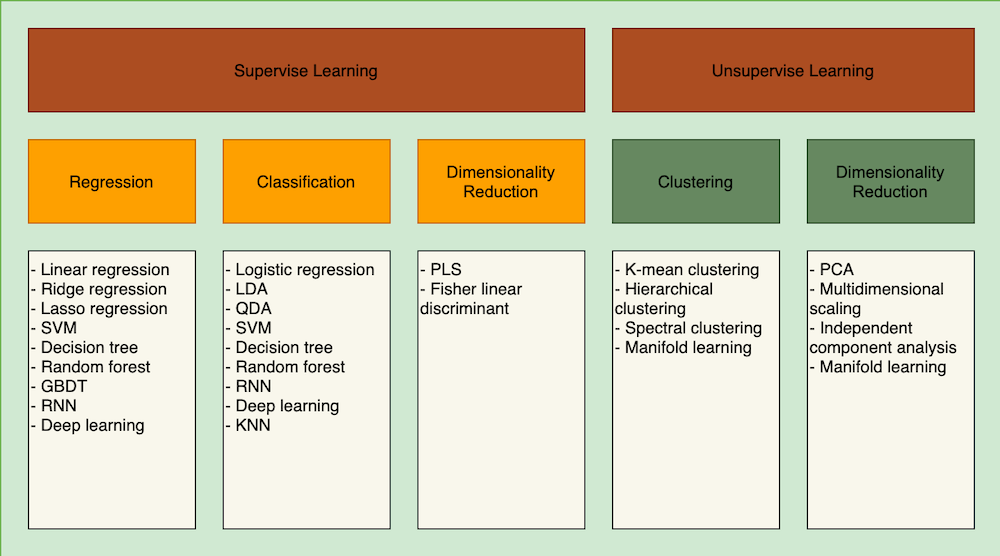
Machine learning category diagram
There are two kinds of machine learning algorithms: supervised learning v.s. unsupervised learning, which is used to address different types of questions.
Supervised learning
Supervised learning is about using the existing data set to deduce a valid intrinsic pattern/relation between the data provided and the dependent variable. The term supervised indicates that the learning process is somewhat monitored or instructed by engineers telling the program what is the expected data while training the model. As explained in the article 【Factor analysis】 Vol. 1. Introduction the idea of factor analysis, the dependent variable is the target variable that you’re trying to predict, and usually is in linear scale or is labeled/assigned to an absolute number or string. When our dependent variable is in scale form (from 0~100, -10000~10000, …), this is the time to use a linear regression model. On the other hand, we’re trying to predict whether a red object with 10 cm height and 20 cm width is a tomato or an apple, this is the time to apply the classification model. Once we have decided what kind of question we’re trying to solve, we started with using the historic data to develop the equation to describe the relationship between an object and its attribute. In the end, we feed the data into this equation to produce the predicted dependent variable.
Linear regression sample data
| No. of the citizen | Degree of Happiness (0~100) | Gender | Age | Occupation | Location | Income | Marital Status | Number of social gathering per week |
|---|---|---|---|---|---|---|---|---|
| No. 1 | 60 | male | 28 | miner | village A | $2,000 | single | 2 |
| No. 2 | 80 | female | 32 | housewife | village B | $100 | married | 5 |
| No. 3 | 77 | male | 63 | retired | village C | $500 | divorced | 12 |
| No. 4 | 58 | female | 22 | OL | village A | $1,300 | in a relationship | 7 |
| No. 5 | ? (Predict the value of happiness) | male | 33 | miner | village C | $1,800 | married | 3 |
Classification sample data
| No. of the citizen | Level of Happiness | Gender | Age | Occupation | Location | Income | Marital Status | Number of social gathering per week |
|---|---|---|---|---|---|---|---|---|
| No. 1 | Not happy | male | 28 | miner | village A | $2,000 | single | 2 |
| No. 2 | Happy | female | 32 | housewife | village B | $100 | married | 5 |
| No. 3 | Very happy | male | 63 | retired | village C | $500 | divorced | 12 |
| No. 4 | Not happy | female | 22 | OL | village A | $1,300 | in a relationship | 7 |
| No. 5 | ? (Predict the level of happiness) | male | 33 | miner | village C | $1,800 | married | 3 |
Taking the example from that article, the Degree of Happiness would be the dependent variable that we’re trying to predict. By using the equation we developed based on the data feed of citizen No. 1 ~ No. 4, we can somewhat speculate the degree of happiness of citizen No. 5. To tell you the truth, it just feels like you’re taking a math exam, and there are a dozen of equations with answers were on the paper but not the last one. You were asked to check the equations listed and find the hidden pattern so that you can fill in the last blank square.
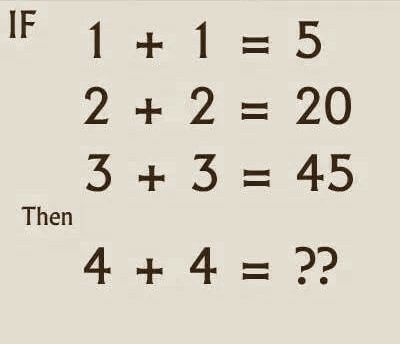
Machine learning is just like a program to solve this question
For more detail, you can check out this video from Andrew Ng for his Stanford University open courses to know more about supervised learning.
Unsupervised learning
Contrary to supervised learning, unsupervised learning indicates that the model can be trained without human intervention. The model would be able to classify and label the data into several different groups. But unsupervised learning wouldn’t be able to apply to the scenario if you would like to predict the exact value in linear scale as no reference values from human beings were provided.
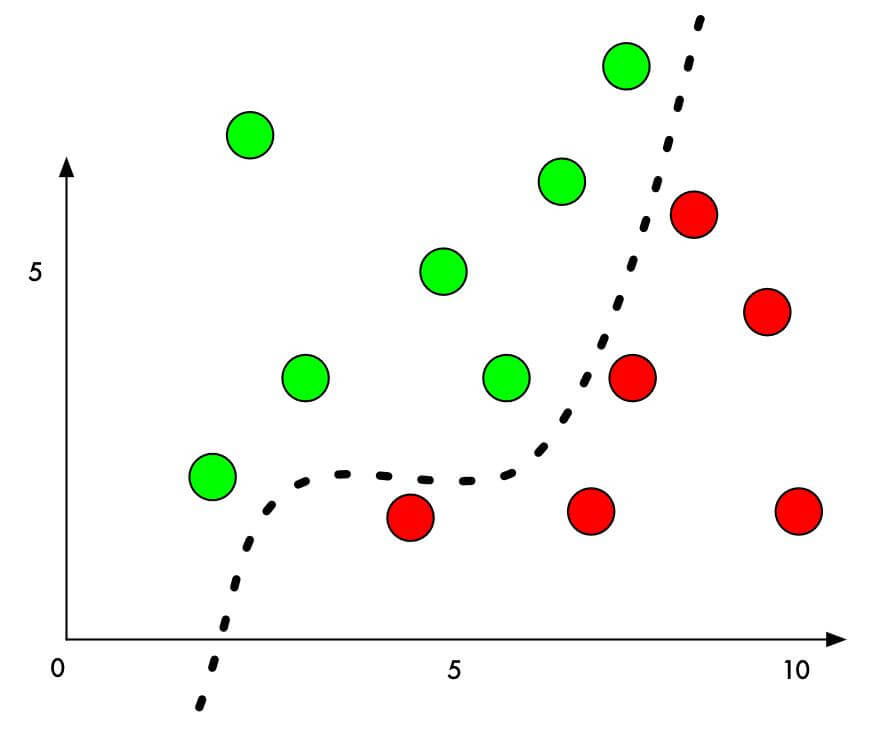
Illustration of unsupervised learning plotting
You can see the dotted line in the above image as the trained unsupervised learning model. As soon as there are new input data plotted in this two-dimensional plane, the classifier would be able to identify this new point belongs to group green or group red. In the meantime, the dotted line itself will be adjusted according to the new added value by changing its shape.
Check the below video if you want to know more detail about unsupervised learning.
How does machine learning work?
Since we have the big picture of what machine learning is about, there are certain steps to follow in order to build our own machine learning boilerplate.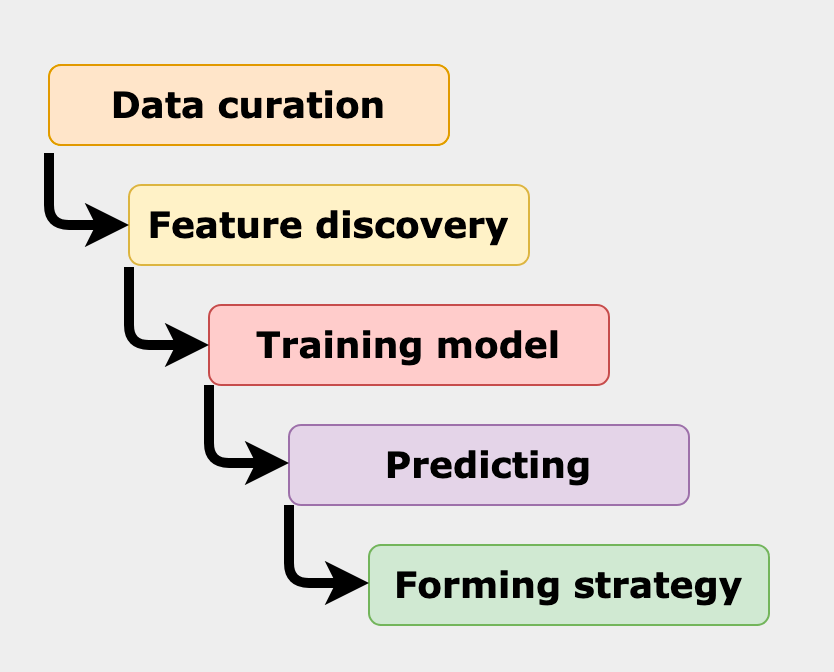
Process of how machine learning works
Data Curating
First of all, we need to collect all the data we need. In the article 【How 2】 Vol. 2. How to build an automated stock trading script, there are several sources that we can get historic data from:
- Quandl
- yfinance
- IEX Cloud
- Tiingo
After getting the raw historic data you need, the data still needs to be cleaned, indexed, sorted, and even adjusted to fit your needs. There’s a sentence that I read somewhere that really illustrate the importance of this stage:The data provided decide the celling of your strategy return, and implementation of your machine learning is how you approach this celling.
Therefore, making sure you have quality data is very crucial before proceeding to the next step.
Feature Discover/Analyze
Features/factors are the meaningful signals/data that transformed from the raw data, such as historic open/close/high/low price of each stock, or EPS that processed from the numbers in the balance sheet. Here’s a quick introduction of factors that help you understand what factors are about: 【Factor analysis】 Vol. 3. Construct your own factor
Training the model
Simply put, we use the data that we acquired from the previous two steps and feed it into the program in order to deduce the equation that describes the relationship between dependent and independent variables. The deliverable of this stage is the trained model that will be carried into the next stage.
However, the reality is that the above scenario usually takes weeks and even months to complete. First of all, there are numerous models to choose from, depending on what kind of questions you’re trying to solve. Secondly, you also need to do research on what are the best parameters such as learning rate(linear regression) and number of leaves(decision tree) that best fit your model and dataset. By the time you finally find the right model and the parameters that give you the best training score, you were told that your model is overfitted, which means that your model is only valid in a very specific situation. Then again you need to go back to the beginning to strip off those restrictions that you put on the model.
Training the model is probably the most suffering and unbearable period for a data scientist in terms of time and the number of frustrations. But, the outcome would be rewarding as long as you’re able to produce a well-trained model that proved to be able to predict the outcome.
Predicting the expected variable
This is the most critical but requires the least effort part among the entire processes. We generate the predicted value by feeding the latest factor data into the equation. In the linear regression type of models, we will get the exact numbers as our prediction, or we will get a label when applying classification type of models. Then we can generate buy/sell signals according to the outputs and further form our investment strategy.
Forming strategy and backtest
Lastly, we will need to put everything we have together to form the investment strategy. This investment strategy will include the buy/sell signals from the previous step so that we know when to add certain stocks to our portfolio or remove them. Then, we evaluate the profitability of this strategy based on the backtest results. Once we confirm that this strategy would bring us a high enough sharp ratio and low enough risk, then this strategy is good to go.
What are the FAMQs (Frequently Asked Myself Questions)?
Working on your quantitative research is a process of putting your thoughts together. In order to prove your strategy works and is profitable, you have to question each step in your research to make sure you’re logically bullet-proof. Survivor bias, look-ahead bias, and data snooping are the problems and biases that you need to discover and address before moving your strategy to the implementation stage. I found I asked the following questions to myself so many times and turned out these questions did help me spot the issues buried inside the codes.
Are we using yesterday’s data to predict tomorrow’s return?
When training your model and predicting the future stock return, you need to make sure you’re using the data that is already publicly available on the day. For example, we have sample data that looks like below:
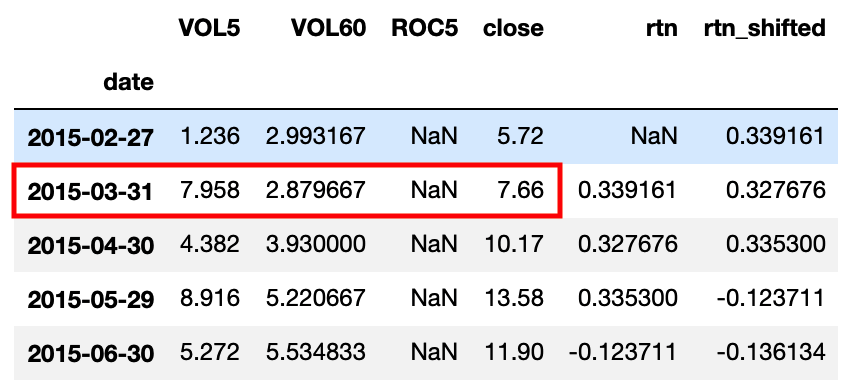
Sample data including close price in monthly frequency
In order to train our model correctly, we need to use currently available data to predict the future return. VOL5, VOL60, ROC5 are the factors we use in the model training, which are only available AFTER the market is closed on the day. We use data['close'].pct_change() to calculate the monthly return in rtn column. However, if you look at the 2015-03-31 row, you’ll find out actually using the after-market-close data to predict the price change of the same month (It requires a bit of imagination and the sense of time). This would give us a relatively high model score as the close price and the return we calculated are highly correlated. Therefore, we need to shift the rtn column to the previous month into rtn_shifted column, so that logically we will train our model with today’s available data against next month’s return.
This is the must-ask question before you start feeding your data into your training model. Also, this time-related relationship would change based on your data source and the sample period of your data. So do ask yourself this question every time after you processed your data and before you start training your model.
Should we use classifier or linear regression type of models?
As explained in the above section, there are two types of models for you to choose and you decide which one could better solve your question. We realize that the classifier type of model works better than the linear regression type of model from the past experience. The reason is that the stock return is fluctuated and is very easy to be influenced by extreme values caused by black swan incidents.
To mitigate the impact from the extreme values, we can label the records that we deem profitable to True and label the ones that we see as not profitable as False. So obviously, we reshape our question from predicting the exact future return to finding out the stocks that we think are profitable. Doesn’t this sound much more feasible for our program to find a boundary separating profitable and not profitable stocks than find the exact stock return? For example, we can label True to the stocks that have one month return is higher than 8% (including the commission fee that we need to pay and the slippage that happened when the stocks bought and sold), and label the rest to False.
Once we process our data this way, we can remove the noise to a certain extent and increase the accuracy of our machine learning model.
What is the best size for the data when training the model?
Sometimes the data scientist found out that their machine learning wouldn’t converge while training their model because their model wouldn’t be able to find the optimal equation. Then one of the solutions is to acquire more data to be added into the training set so that the program will have enough data to judge when and where to converge and to find the optimal equation. However, this solution is not 100% true when applying the machine learning algorithm to quantitative investment.
Theoretically speaking, the stock prices were impacted by the most recent corporate news and facts. As time passes by, the magnitude of the impact will gradually fall off. If we use the trained model trained with data 10 years ago, the ability to predict the future price is weakening as the market would no longer recognize the corporate news and facts.
Hence, the size of your training data wouldn’t matter, but the immediacy of the data does. Historic data within two years (24 months) would be recommended to be used to training your model.
Postlogue: What is our ultimate goal of developing a quantitative investment strategy?
After reading various articles regarding developing quantitative strategies and studying critical metrics that show how to better evaluate the strategy performance, I was convinced that pursuing high return and low risk of the strategy would be our mission. However, I read a quote from the book Advances in Financial Machine Learning by Marcos Lopez De Pardo that really inspired me.
Think it like running a business.
Professionals develop methods to mass-produce strategies. The money is not in making a car, it is in making a car factory.
Therefore your goal is to run a research lab like a factory, where true discoveries are not born out of inspiration, but out of methodic hard work.
By saying that, we should put more attention to building the processes and tools so that we can conduct the quantitative research in a faster and more accurate fashion, instead of dedicating indefinite time to PERFECT our high-return strategy. Any high-return strategy would eventually be retired one day as the macroeconomics shifts or as the regime changes. Or to say, there’s no such a strategy that keeps making profits without investor’s constant attention to adopting all the potential changes in their strategy variables.


