Previous reading
- 【Factor analysis】 Vol. 1. Introduction the idea of factor analysis
- 【Factor analysis】 Vol. 2. Get ready - preparing and cleaning data
- 【Factor analysis】 Vol. 3. Construct your own factor
After we have collected all the fundamental data and have produced the factor data we need, how we can utilize them to compete with the market and to beat the benchmark return?
One of the common methods would be factor score. In this post, we’re going to describe and implement this factor score method to see how we can rate the stocks that have more potential to rise than the others in the future.
What is factor score?
The factor score is also called the component score. This method essentially uses the factors we have produced to score the quality of the stocks, based on the correlation between the individual factors and the next day’s return. The higher the sum of the correlations of factors, the higher the tendency of the next day's return is the central idea of using the factor score method to predict the future trend. Therefore, once we have done that for all the stocks that we’re monitoring in our candidate portfolio, we’ll be able to rank the stocks and buy the top N stocks that we perceive will generate a higher return than the others.
There are two ways of achieving this goal:
- Using linear regression
- Using IC (Information Coefficient) & IR (Information Ratio)
Linear regression is the most common way to be used in the factor score. However, there are many ways and theories to implement linear regression. Here, let’s use a much easier and simpler way to demonstrate the idea of the factor analysis. We are going to adopt IC/IR method as an example throughout this tutorial.
Strategy and details
Let’s start with detailing our strategy guidelines and define our question here. Using the composition of the S&P 500 index as our candidates, we would like to build a portfolio that tracks the trend of S&P 500, but in the meantime performs better than the S&P 500 index. Here’s how to do it:
- Get the S&P 500 index composition over time.
- Select what factors we’re trying to exam against the score
- Process the factor data.
- Calculate the IC and IR to find out the relationship between the factors and dependent variables.
- Calculate the factor scores
- Check the results
Get S&P 500 index composition over time.
This part we have covered in 【How 2】 Vol. 4. How to produce the S&P 500 Historical Components & Changes
Select what factors we’re trying to exam against the score
Even though we have tones of factors in our arsenal, we’re not going to use them all.
Factors are simply objective data and they could have little or even zero correlation with the next day’s return. Just like in the happiness survey in our previous post, that not every data in the survey would be highly related to the happiness of the people in the country. Probably the Gender column is meaningless as it’s not the major decisive factor whether people are happy or not. So selecting a defined factor set would be our fundamental assumption to interpret what factors really contribute to the next das return.
Process the factor data
Process the factor data to be used in the factor score. There are three steps to standardize our data:
Winsorization (Removing the extreme data)
Winsorization would help us remove the extreme scenarios that affect our final ranking significantly. The blue dots over the line in the below diagram could be the results of unexpected incidents or news such as the GameStop short squeeze incident not long ago. Therefore, we’d better remove them in order to better rank the stocks.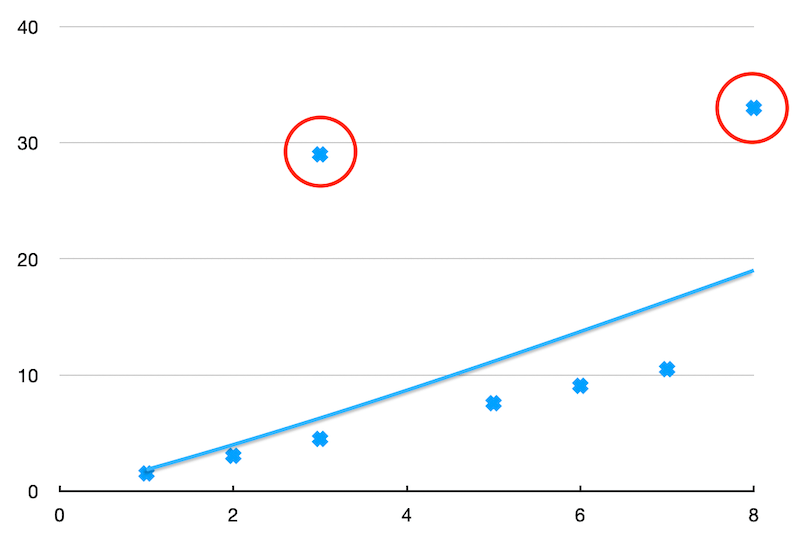
Industry neutralization
Industry neutralization removes the difference across industries. For example, the average market cap of the Technology industry in 2020 is around 1.24 billion, but the average market cap of the Energy industry is only 0.23 billion. Therefore, neutralize the industry impact would help us remove this inevitable biased data.
Standardization
When we investigate how does stock abc do on EPS 1.2 compares to the industry standard 0.8, which 0.4 difference. On the other hand, stock xyz‘s EPS 15.3 is 3.1 points away from its industry standard. Simply compare 0.4 with 3.1 will not be able to define how abc or xyz do in its own industry. So, Standardization meant to convert the raw data into standardized data.
| - | abc | xyz |
|---|---|---|
| EPS | 1.2 | 15.3 |
| Industry | Finance | Consumer goods |
| Industry EPS standard | 0.8 | 12.2 |
| Difference | +0.4 | +3.1 |
| Industry EPS standard deviation | 0.2 | 2 |
| Standardized score | 0.4/0.2 = +2 | 3.1/2 = +1.5 |
So by looking at the standardized score, you can tell that actually stock `abc` does better than stock `xyz`
Calculate the IC and IR
Information coefficient is to calculate the correlation between the factors and the next day’s return. Therefore, the higher the IC of the factor indicates that this factor would better help predict the next day’s return.
Information Ratio then stands for whether the IC is stable or not. If IR is high, then it means its IC is more stable and even better in terms of interpreting the change of the next day’s return.
The reason we calculating the IR is that we need to evaluate the impact on the factor to the next day’s price. So once we are able to get a series of IR, we calculate its weight among all IR in order to know whether this factor is strong and stable enough.
Get the factor scores
By having the IR weight series, we can now multiply them with the factor itself, sum them up, and come out of a score to stand for the quality and traits of this stock.
Check the results
As our goal here in this post is to use the factor score to find out the profitable stocks among the S&P 500 index composition stocks, we can examine how effective our factor score work by the following steps:
- Sort the stocks by factor score
- Split the stocks into N groups that contain an equal number of stocks.
- Add up the daily return in the same group and compare it to the other groups over time.
If the factor set that we define is good, then we expect to see the trend of the accumulate daily return in each group diverge as much as possible as below line chart: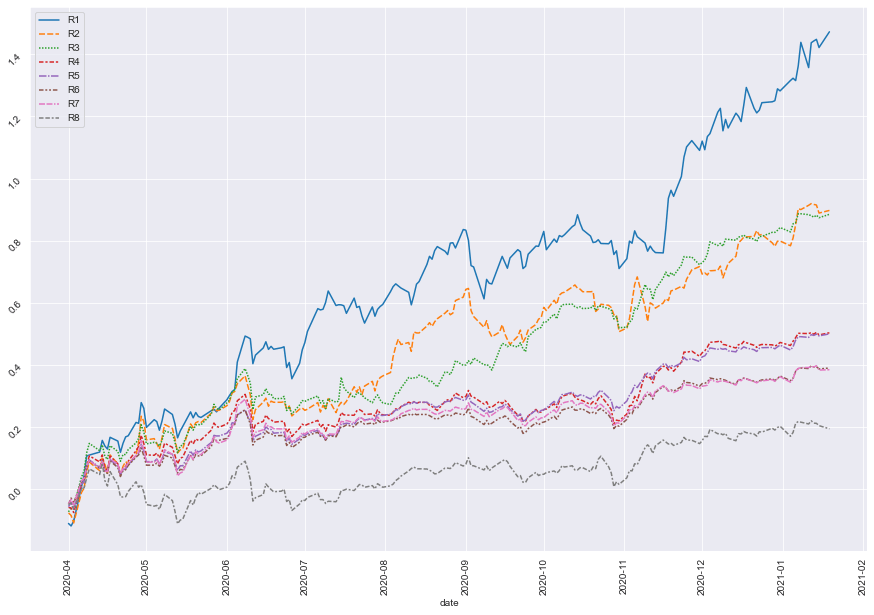
On the other hand, if our factor set is not good enough to interpret the next day’s return, we’ll see the cumulated daily return of each group tangled together. This means that our factor set would not be able to separate the good stocks from bad stocks.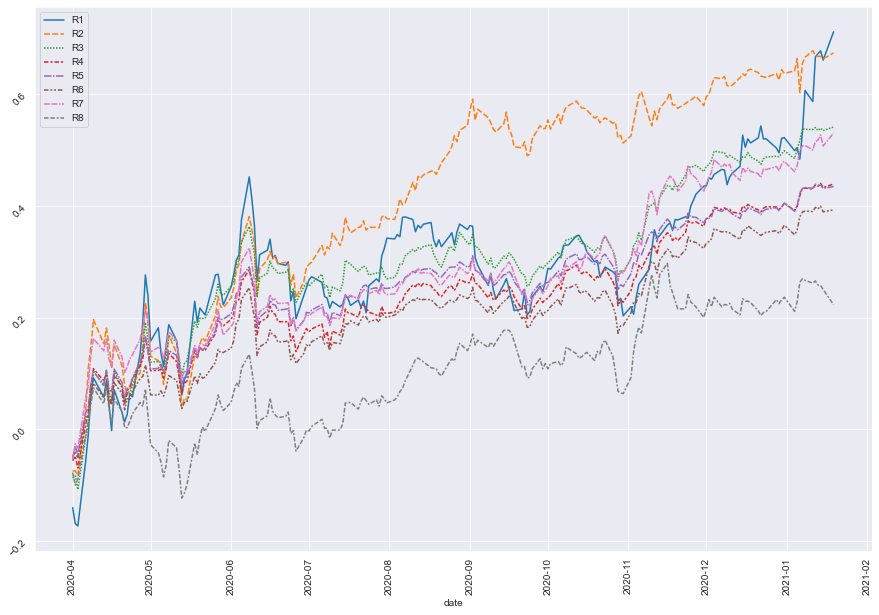
Finally, we might need to go through a various combinations of factors to find out what factor set possesses the capability to rate the stocks, we need to execute the steps from 3~6 multiple times. The effectiveness of the factors would also be voided due to the macroeconomic changes over time. Once we are able to find that factor set, then we can proceed to the next step to get more detail by comparing our portfolio performance against the benchmark portfolio performance.


