Tradable securities are the securities that are available to be traded on the market that day. Each security could be either add into or remove from this tradable set such as delisted, company bankrupt, and so on. It’s important for us to obtain this list before we place the order on the day, otherwise, we’re probably going to buy or sell the securities that are not available on the market.
In this article, I’m going to talk about how I built mine by reverse engineering what I have in order to build this tradable securities list. Even though it’s probably not the most accurate one, but could be a start for those who don’t have enough resources to get these tradable securities from elsewhere.
Why we need this list?
You may ask, what do we need the list for? We could simply use all the stock symbols available on the list in the article 【How 2】 Vol. 1. How 2 get all tradable tickers in US markets, right?
No. There is one common bias here that needs to be avoided or mitigated to a certain degree:
Survivor bias
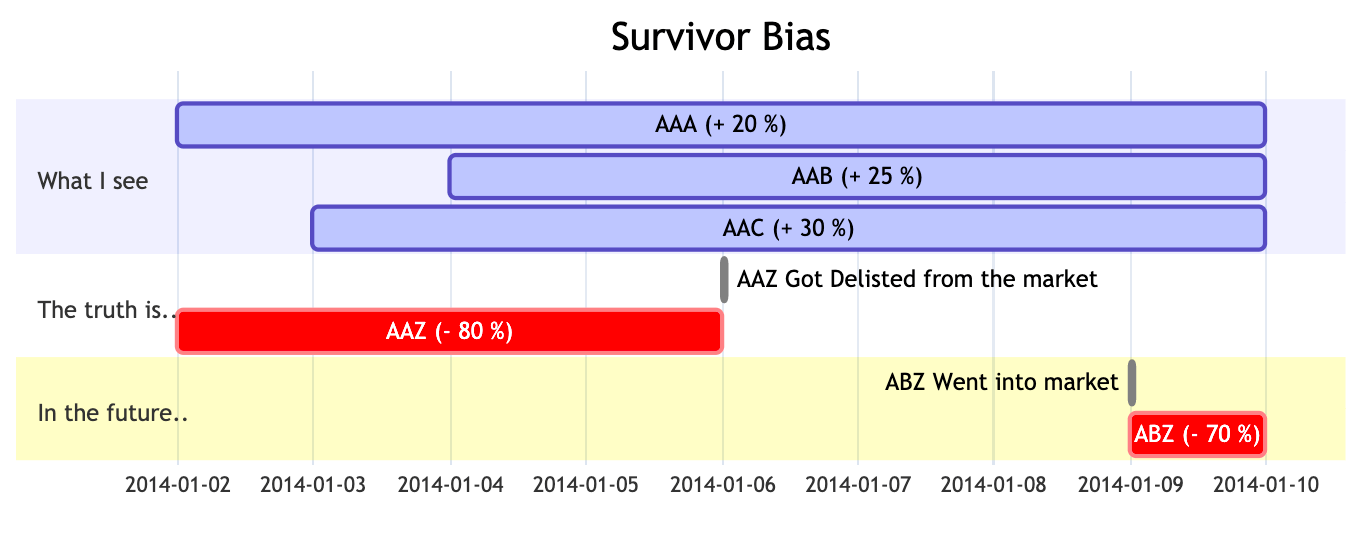
This bias indicates that the result we’re looking at today, actually already went through a series of selection, competition, or elimination.
For example, we’re analyzing a two-day lookback period and deduced that all the stocks whose symbols start with “A” will very likely to make a positive return this year. When we look back 2 days from 2014-01-09, we don’t know the existence of stock “AAZ”. The stocks we’re looking at are the survivors from the market competition, inducing us to come to this false conclusion. Hence, on the next day of 2014-01-09, a new stock “ABZ” come to the market. You are very likely to lose more money on the stock as it has “Z” at the end of its symbol that is actually not a good stock, just like the previous market loser “AAZ”.
So using the tradable securities of today to backtest against the historic pricing data would not help us to better predict the future, because we’re looking at the past data through a filtering glasses called “future”.
You must be smart enough and be able to figure out the data format we need to represent the stocks that are available each historic day on the market by now:
1 | { |
Then, the problem is …
The problem is, I haven’t seen any public data out there that are provided except the dataset QTradableStocksUS() on Quantopian. Also, we can’t use data provided by NASDAQ or NYSE, as this data is not going to help us waiving the survivor bias that we mentioned above. Then, how do we produce a somewhat quality tradable stocks set for backtesting?
Methodology and thoughts
I’m going to quickly explain how I built the tradable stocks set based on what I have. If you’re not interested, you can directly go to the bottom of the article to download the tradable stock set since 2014-11-03. If you still have the last piece of conscience in you, please bear with me and read this through …
Reverse-engineering
Since there is no public data for the historic tradable stock symbols, I’m thinking maybe we can somewhat confirm the fact that the stock traded publicly on the market that day is included in the tradable securities. So we can say, if a stock has a close price and trading volume that is not zero, this stock must be included in the tradable securities. Therefore, here’s what I’m going to do:
1. Download the historic price of all stocks that I can find.
Use the below code to download all necessary stock historic daily prices from Tiingo. And, I use multiprocessing package to speed up this process.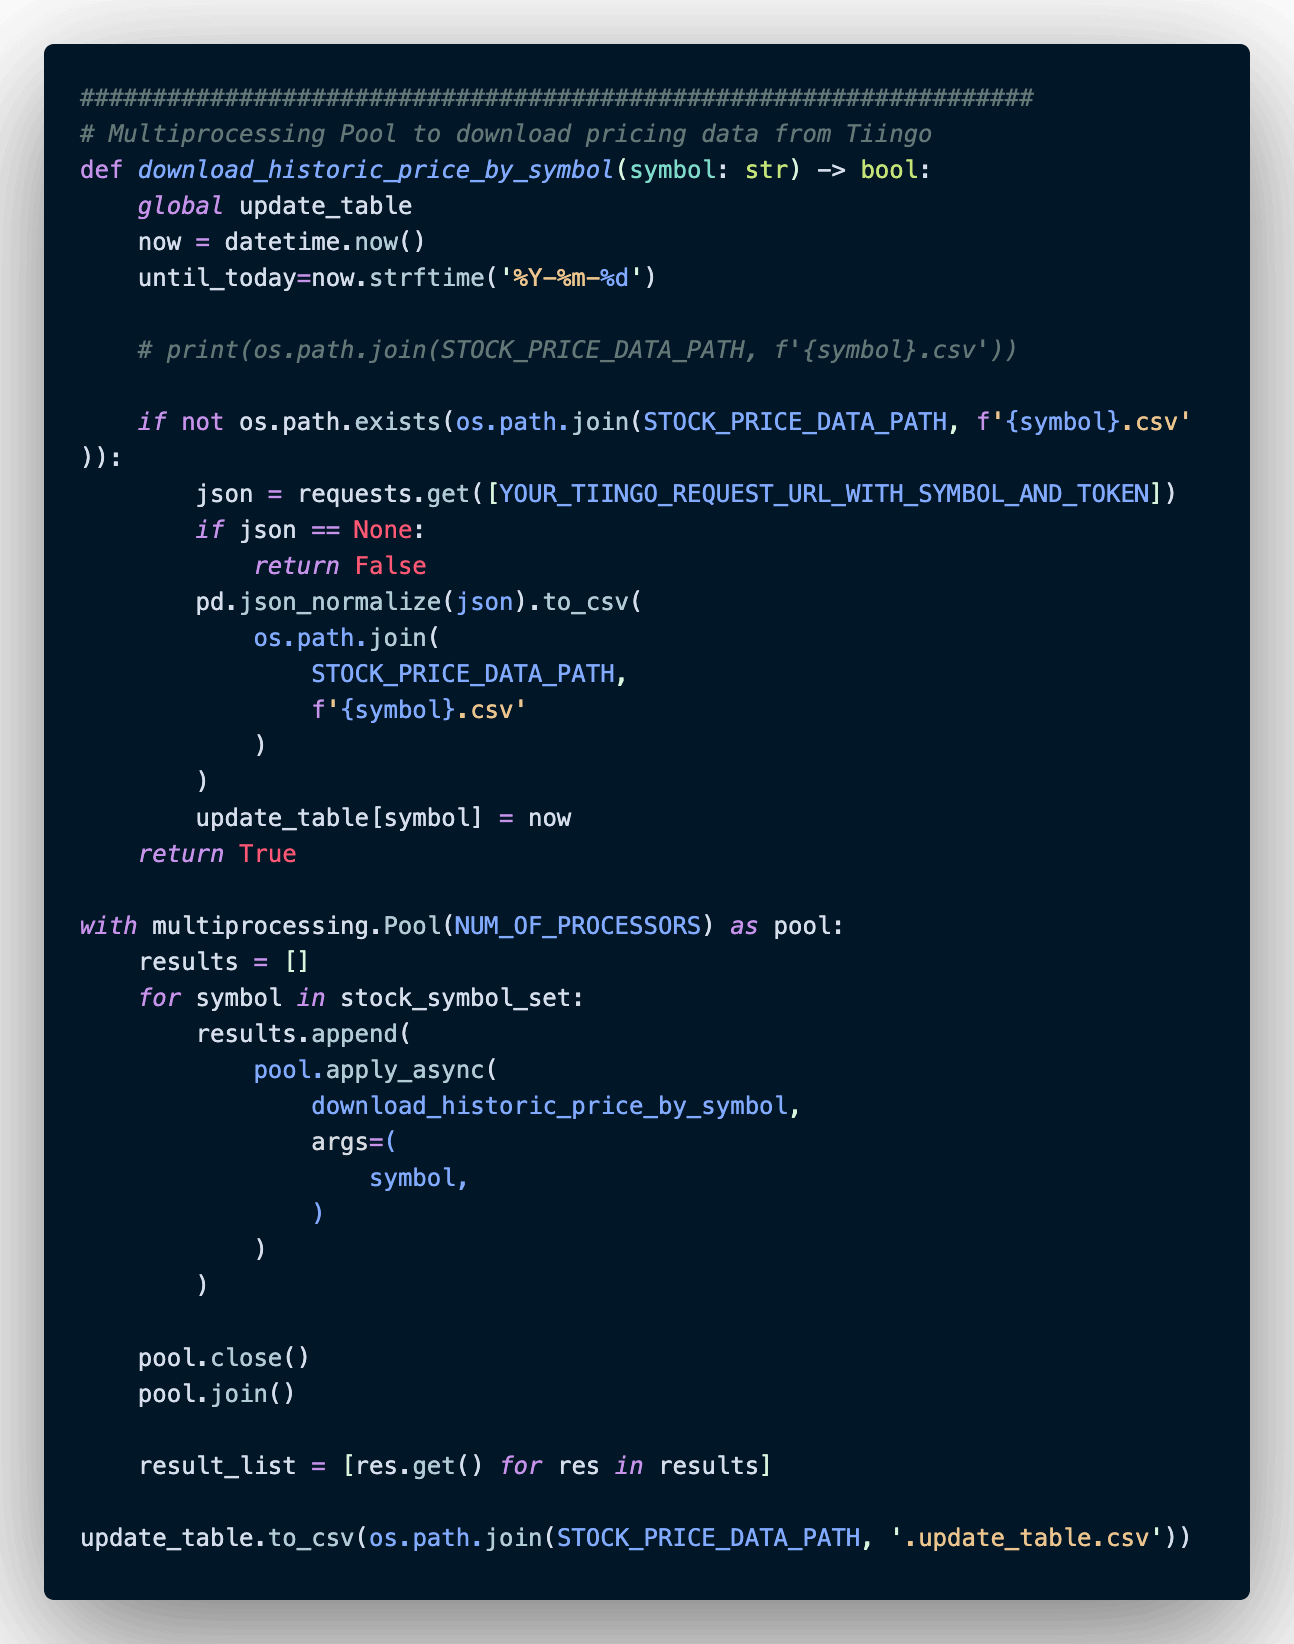
2. Combine these historic prices on the key “date” into one big table.
By following the below process, you can get a big table that has the date on the index and the stock symbol in the column.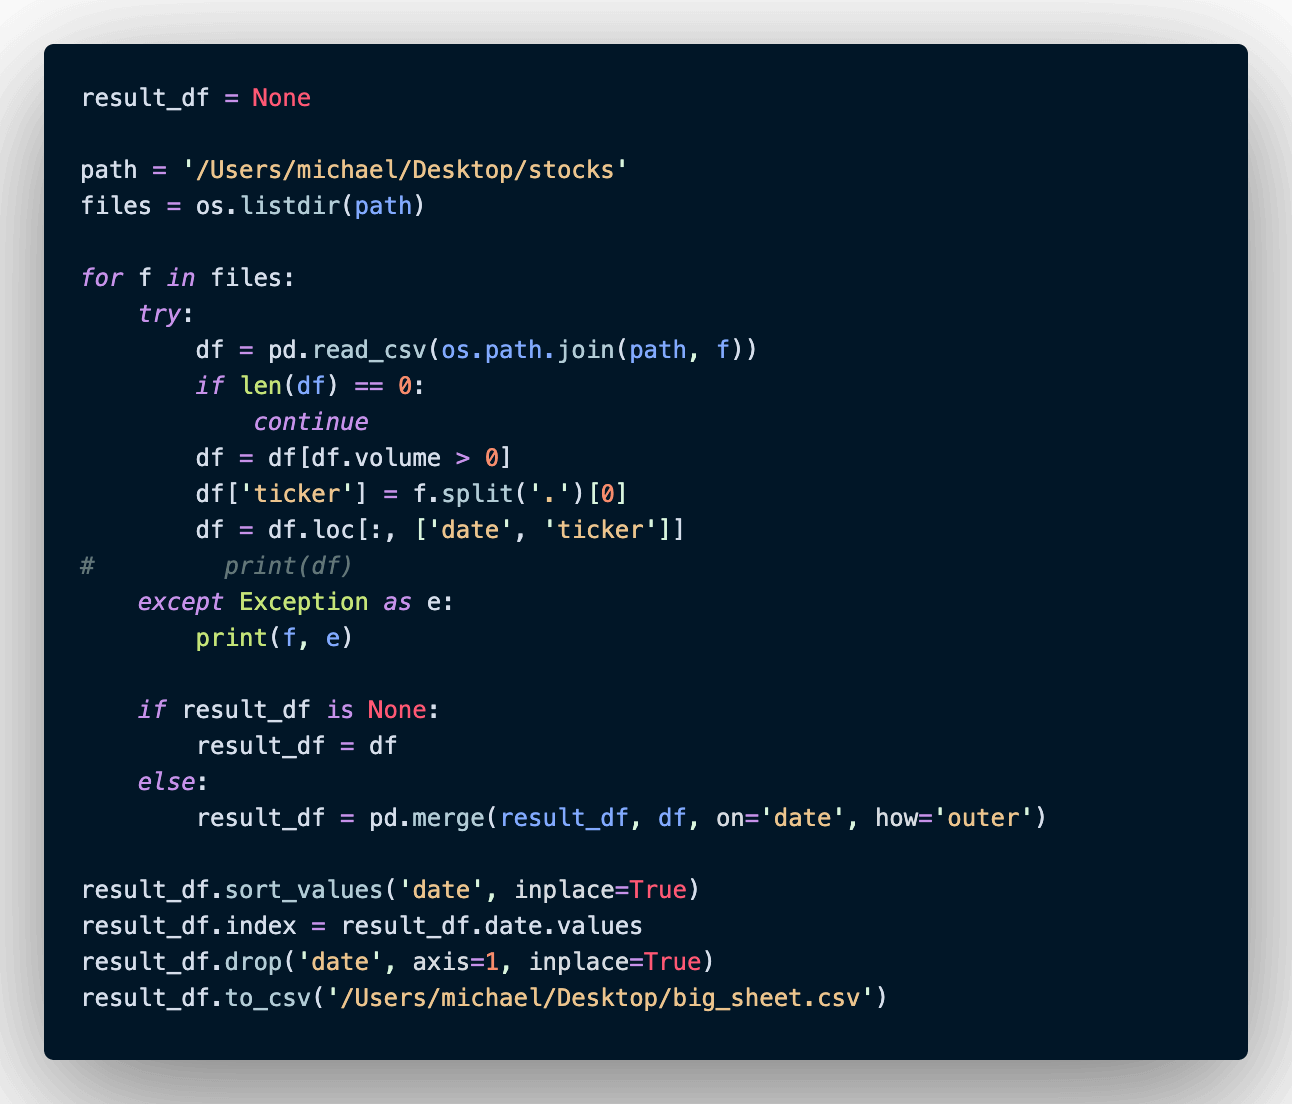
The result will look like the table below: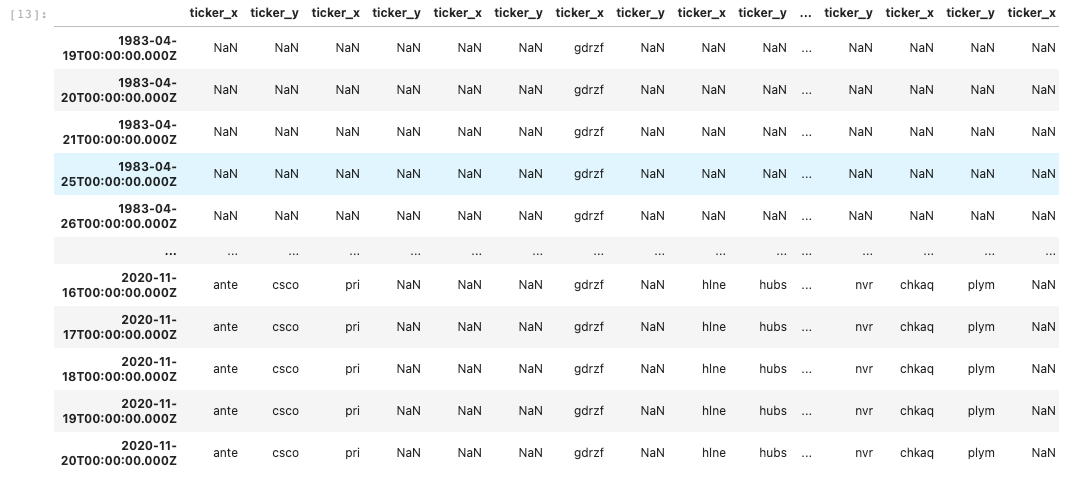
Then one important step that we need to do is to look at the data and see how many data were missing from the source provided. By using the seaborn.heatmap() to visualize the data and find the gap. We’re not going to check all the stocks as there are 14k stocks on my list. So I’m going to inspect stock No. 2000~3000. Here’s the data from 1989 to 2020-11-23: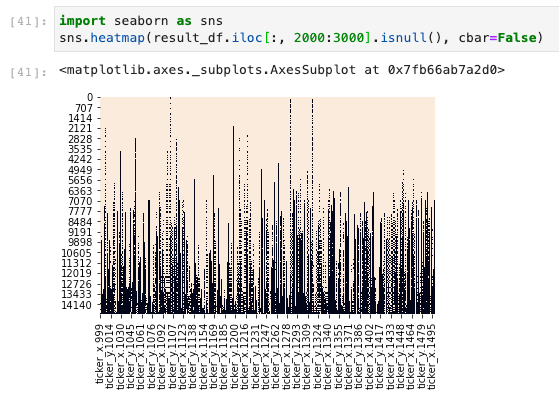
It seems a lot of data was missing from the beginning. As my backtest won’t include the datetime this long ago, I’m targeting to get data from 2014-11-03 to 2020-11-23. Now the diagram looks like this: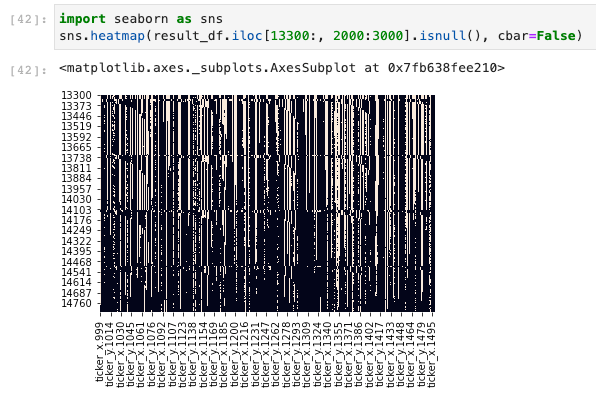
Um… It’s better now. Let’s use this as a base to move on.
3. Go through this big table by day, and mark the stock that has “Close” price and “Volume” is not zero as true.
Here we’re going to produce the positive mark for each stock to see whether we’re going to include it into the tradable securities or not. There is one more thing that needs to be paid attention to: Data missing rate. We’re not going to pick the stock that misses daily ‘Close’ price data more than 10% of the time. Because the stock could be delisted for a while due to several reasons. But missing data 10% of the entire time is not normal from what I see.
So here’s what I do: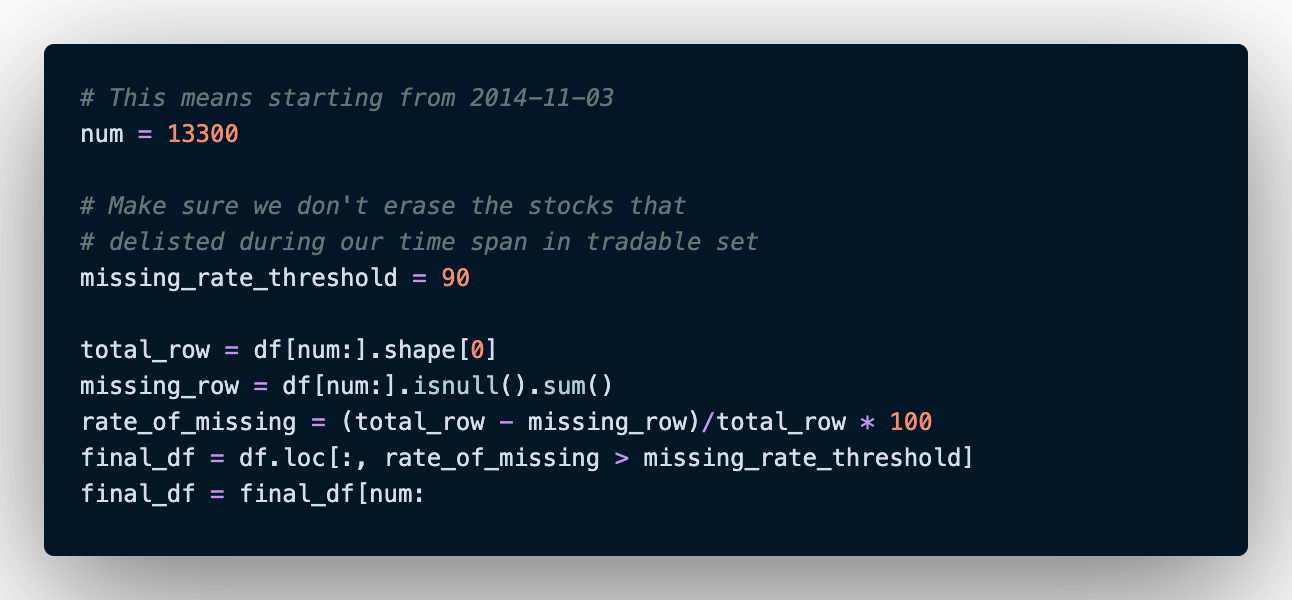
Of course, the missing_rate_threshold can be adjusted as your need. For now, I’m going to keep it to 90 as 90% of the entire time we observed from 2014-11-03 to 2020-11-23.
4. Generate tradable stock symbols by Timestamp
To get the tradable securities on the day of 2014-11-03, let’s first transform this pd.DataFrame into a listed dictionary. After getting our final_dict, we then generate the pd.Timestamp as an index to retrieve the symbols we need. Lastly, we remove the Nan and Null data with pd.isna() function. Then we’ll get the tradable securities on the day of 2014-11-03.
To conclude
Now we’ve come to the end of this article. I hope putting my train of thought here would make it easier for you to understand. Or leave your comments and let me know where I can explain better. Hope this helps people who are on the same road as I am.
Misc
Attach the entire code here
1 | import pandas as pd |
Download the tradable securities set here
Click here to download the file for tradable stock set since 2014-11-03


