I’ve been thinking for weeks. As a beginner in automated trading and quant trading, what would be the best practical entry-level strategy that I can automate and practice what I’ve been learning? a.) I don’t need to make a huge fortune out of it. b.) I won’t be able to short stocks and no rights to bid on options. c.) I can bear lost as long as it’s not a huge one. d.) I would like to trade daily in order to have further feedback regarding how to further improve the strategy. After days of research, I believe the MACD strategy would be the one to start with.
MACD (Moving Average Convergence Divergence) is a basic indicator strategy for capturing the stock price momentum both upward and downward. The idea of the MACD trading strategy is to buy or sell when the signals were triggered. As easy as that. Even grandma and grandpa can follow simple instructions to profit from the stock market.
There are several explanations of why momentum strategy such as MACD strategy works:
- One explanation is that the momentum generated when the stock price soars more than the market expected, then it tends to generate traction to attract more attention from other investors.
- Another explanation is that investors have a different response time to the good news. Therefore the stock price would continue to rise for several days until all investors have digested the news and made the necessary moves (either buy or sell).
Let’s take this for example:
If you see the price of a popular stock starts soaring and many of your friends telling you that they have bought this stock that might increase its price 5% in the next week. Would you buy it?
This plays a big part in the momentum strategy. The more people are buying and more attention was paid to specific stocks, the more likely the stock price would go up as described in the major economic principle of providing and demand. This is the so-called FOMO effect (Fear tO Miss Out)

The momentum strategies also have their limits:
- The momentum strategy is too well known so that the return/benefit has been diluted as many investors are participating in this game.
- It’s only a phenomenon based on the herding behavior and past history. This strategy won’t be able to predict the future price trend.
- Take the MACD momentum strategy for example, simply using MACD indicators will trigger too many noises and no-profit trades, generating unnecessary trading fees.
Objective
So we need an additional secondary indicator that helps us remove the noise and decide the trend whether it’s upward or downward. What indicator we should adopt to work together with the MACD strategy?
Luckily enough, after reading this article MACD – 5 Profitable Trading Strategies, we have found several options to opt-in. Therefore the objective of this article is to dive-in to the details of how to implement these secondary indicators, and how they perform respectively.
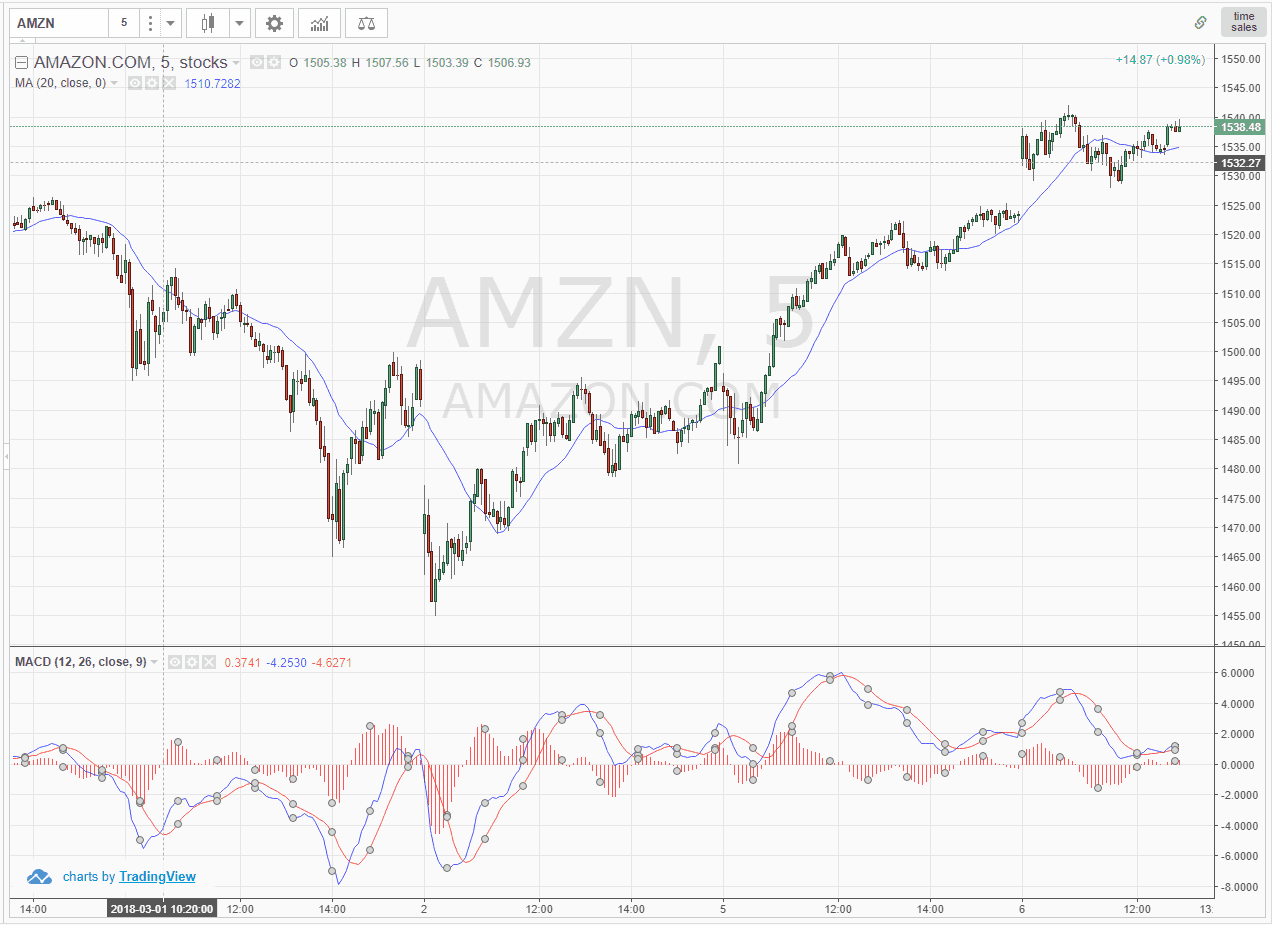
What is MACD?
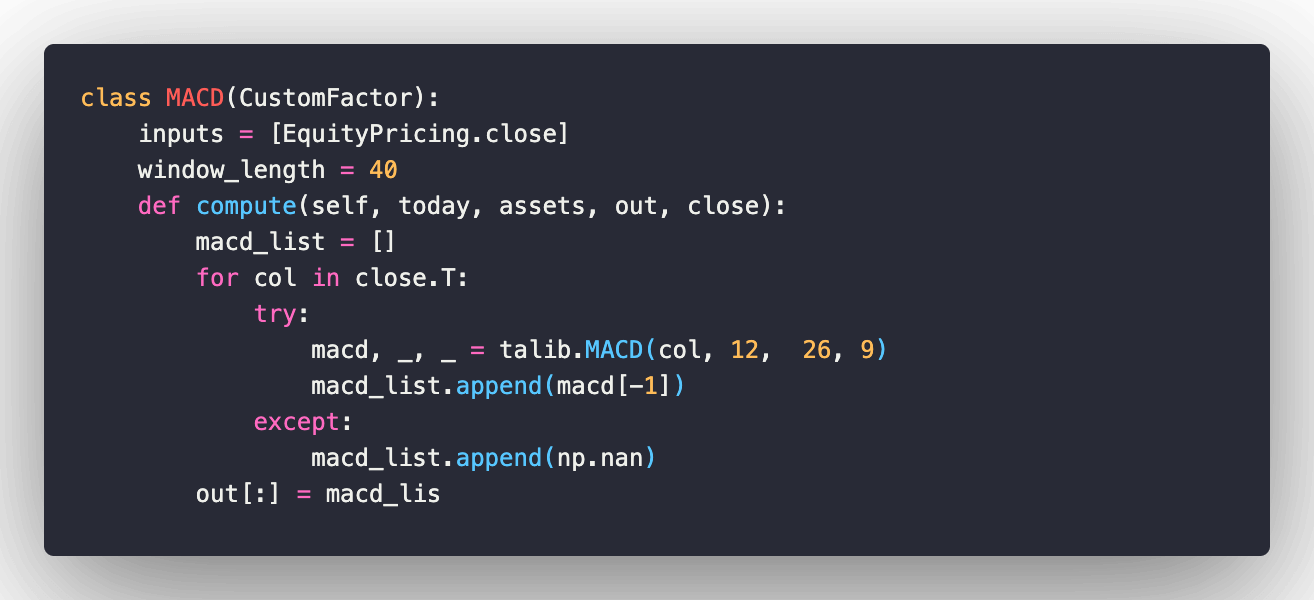
The history of MACD can be traced back to 1979, Gerald Apple invented the MACD indicator, it was an analytic tool for tracking stock and gold price trend. The MACD was constructed by both short-term and long-term EMA (Exponential Moving Average). If the MACD indicator turns from negative to positive, then it’s a buy-in signal; vise-versa. 12 days for short-term EMA and 26 days for long-term EMA are the common setup of the MACD strategy. Here’s a quick guide of how to calculate MACD indicator:
$EMA_{Current} = (ClosingPrice - EMA_{PreviousDay}) \times Multiplier + EMA_{PreviousDay}$
As we are using 10 days in this exponential moving average example, the weighting multiplier would be calculated as follows:
$Multiplier = \frac{2}{TimePeriods + 1} = \frac{2}{10 + 1} = 18.18\%$
$MACD = EMA_{ShortTerm} - EMA_{LongTerm}$
$MACD_{Signal} = 9\,day\,EMA\,of\,MACD\newline$
$MACD_{Hist} = MACD - MACD_{Signal}\newline$
Let’s get started!!
Setup
- On Quantopian platform
- Run the backtest in a five-year span, from Jan 2015 to Sep 2020
- Trading once a day
- Maximum 10 stocks in our target portfolio
- Selecting stocks that are high quality as our target assets universe
- Hedge assets such as Gold or VIX related ETF to hedge the downside risk
Enter and exit Strategy
When the $MACD_{Hist}$ is above 0 together when the signal of the secondary indicator is triggered, this indicates that the current $MACD$ line starts trending up above the past 9-day EMA. So once this combined signal reveals, then we enter the position. When the $MACD_{Signal}$ is below 0, then this means the stock price is starting trending low. So we exit the position to capture the return as much as we can compare to the signal using $MACD_{Hist}$ and $MACD_{Signal}$ both below 0.
PS:
There’s another exit strategy that is quite popular on the internet, that you could set a certain percentage as your take-profit and stop-loss point. For example, you can exit the position once you’ve hit 10% of profit or lost 10% of the original investment. It seems quite make sense to me in the beginning, so I played with it and tried to incorporate this into my exit strategy. It turned out the results didn’t seem plausible. My assumption would be that this exit strategy doesn’t serve the purpose of capturing the momentum in the MACD strategy, as the stock price could fluctuate before it reaches the timing that the MACD signal predicts.
Backtests and results of combination with secondary trigger signals
Let’s start pairing the MACD signal with the secondary signal and see how they were implemented:
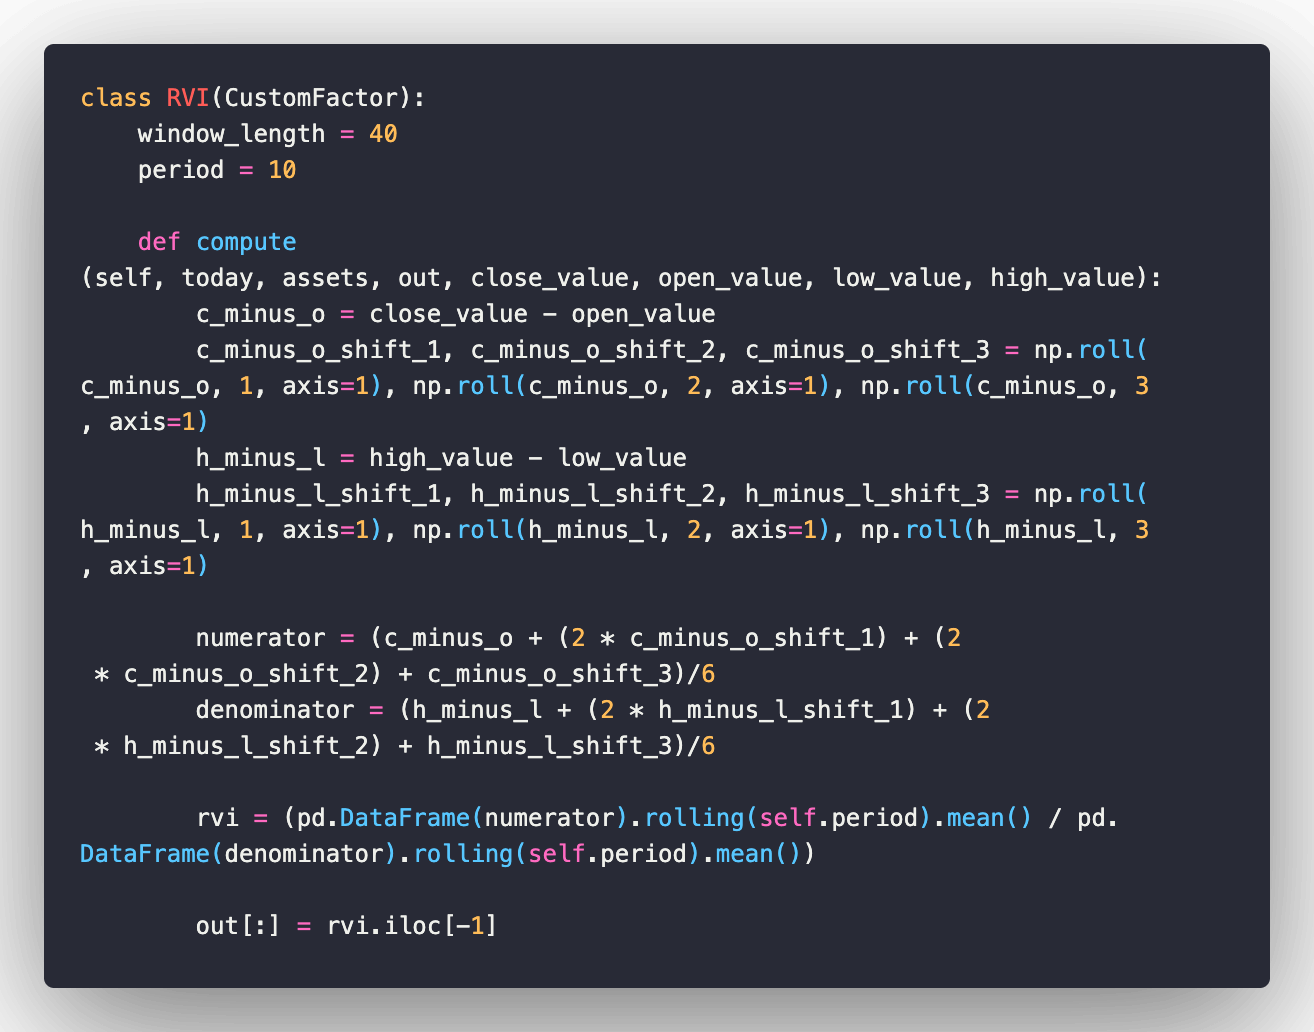
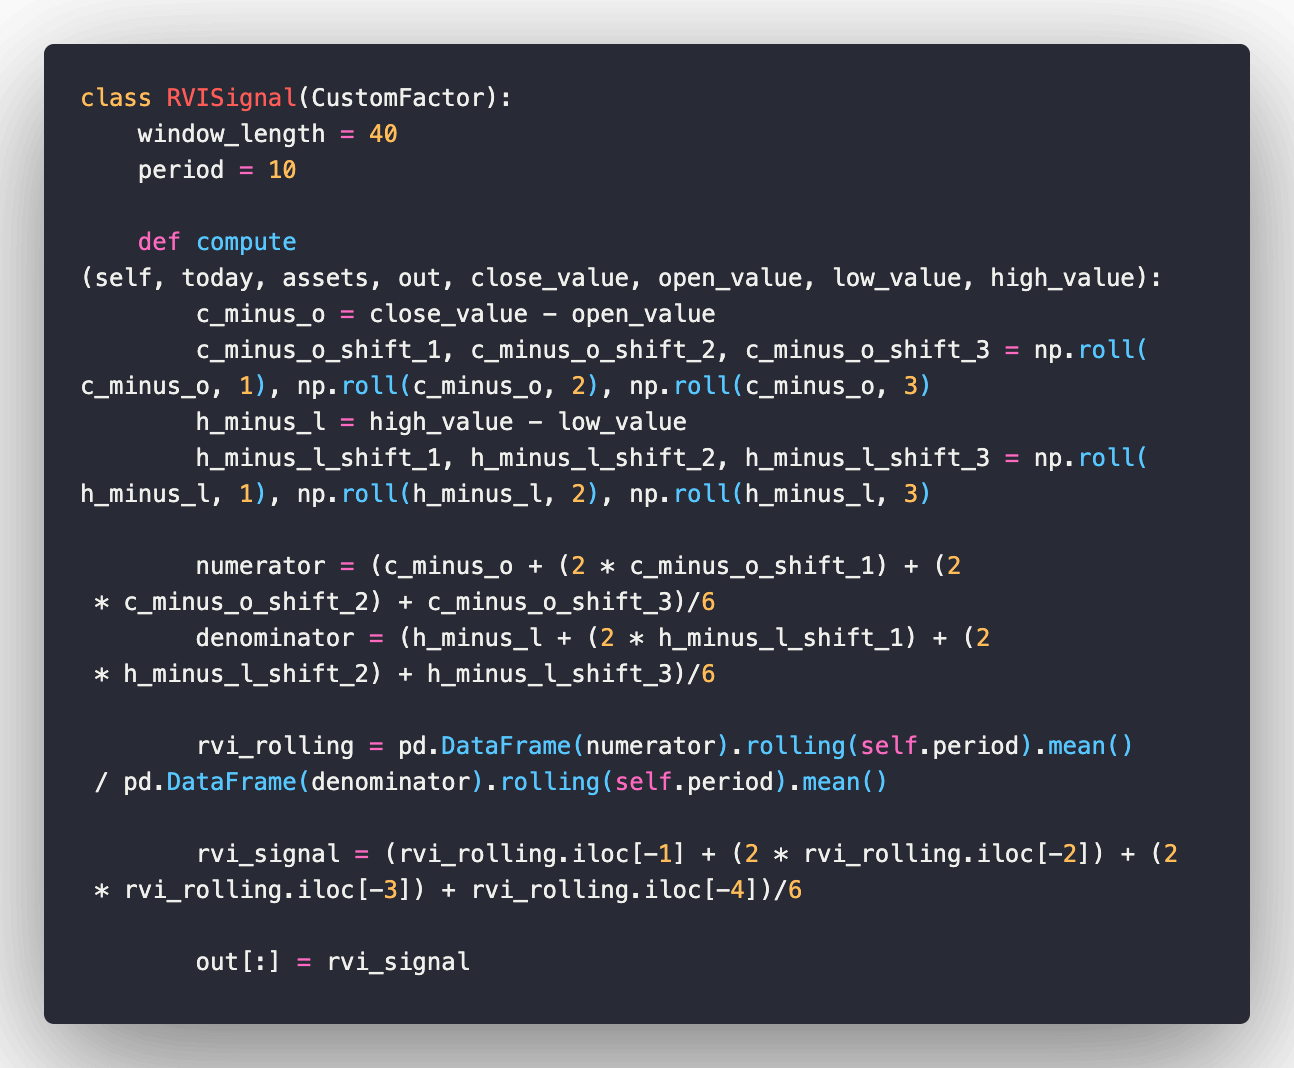
1. Relative Vigor Index (RVI)
RVI is not like the other oscillators that evaluating over-buy or over-sell. By looking at the formula below, it’s more of an indicator to tell whether the stock is vigorous enough to be profitable (either long or short the stock). Therefore, a crossover above the RVI signal line indicates that there is probably a bullish trend in the near future. So we can combine RVI with MACD to form a better-confirmed signal.
$Numerator = \frac{a + 2 \times b + 2 \times c + d}{6}$
$Denominator = \frac{e + 2 \times f + 2 \times g + h}{6}$
$RVI = \frac{SMA\,of\,Numerator\,of\,N\,periods}{SMA\,of\,Denominator\,of\,N\,periods}$
$RVI signal = \frac{RVI + 2 \times i + 2 \times j + k}{6}$
$where$
$a = Close−Open$
$b = Close−Open One Bar Prior to a$
$c = Close−Open One Bar Prior to b$
$d = Close−Open One Bar Prior to c$
$e = High−Low of Bar a$
$f = High−Low of Bar b$
$g = High−Low of Bar c$
$h = High−Low of Bar d$
$i = RVI Value One Bar Prior$
$j = RVI Value One Bar Prior to i$
$k = RVI Value One Bar Prior to j$
$N = Minutes/Hours/Days/Weeks/Month$
Code in python:
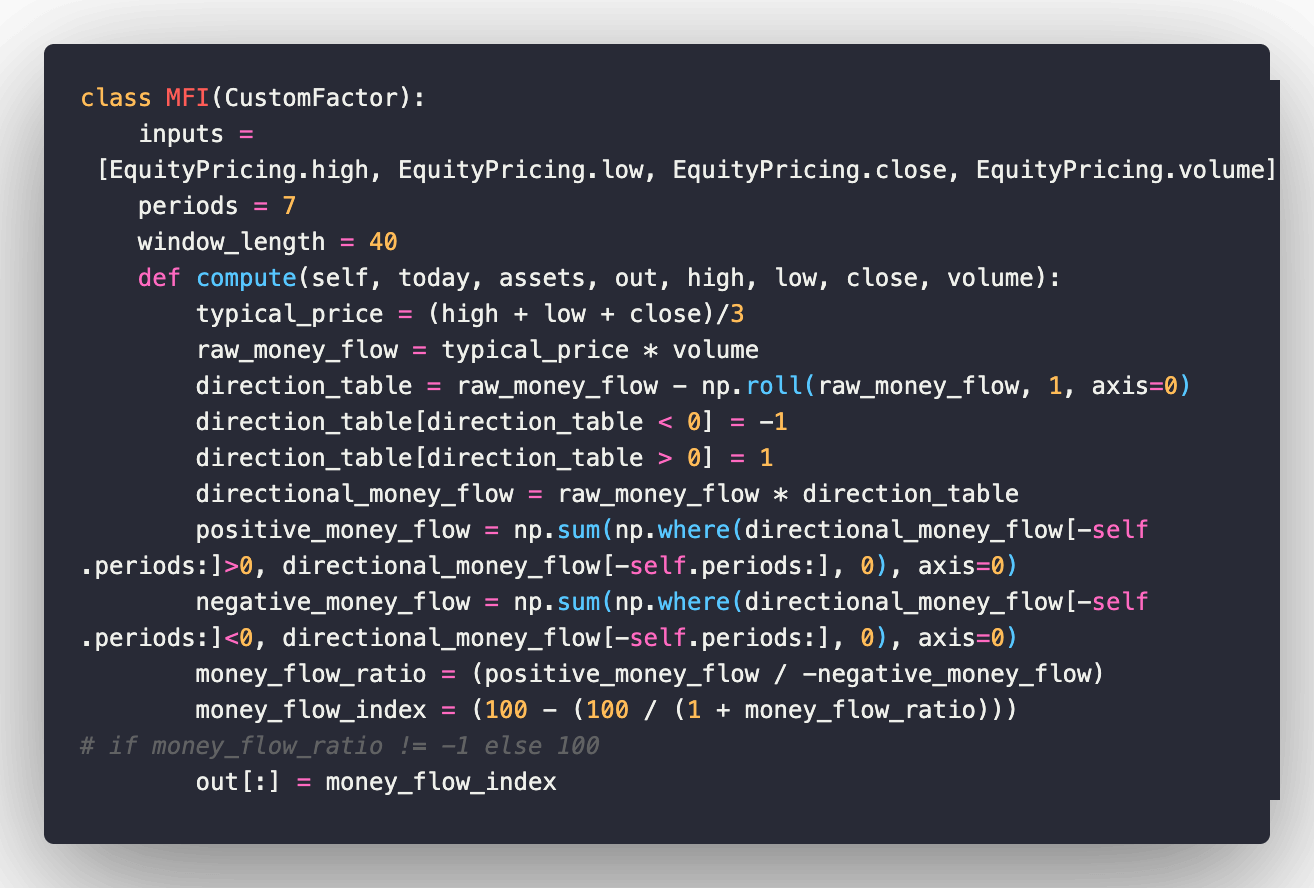
2. Money Flow Index (MFI)
Money Flow Index is another type of oscillator (range from 0 to 100) that reflects the changes in both price and volume, comparing to the other oscillators that reflect price only. So this gives us a better idea of whether the target stock is oversold or overbought when the MFI is positioned at both extreme edges. So we combine the MACD signals with MFI to double confirm the trend of the stock price.
$MoneyFlowIndex = 100 - \frac{100}{1 + MoneyFlowRatio}$
$where$
$MoneyFlowRatio = \frac{14 Period\,PositiveMoneyFlow}{14 Period\,NegativeMoneyFlow}$
$PositiveMoneyFlow = RawMoneyFlow >= 0$
$NegativeMoneyFlow = RawMoneyFlow < 0$
$RawMoneyFlow = TypicalPrice \times Volume$
$TypicalPrice = \frac{High + Low + Close}{3}$
Code in python:
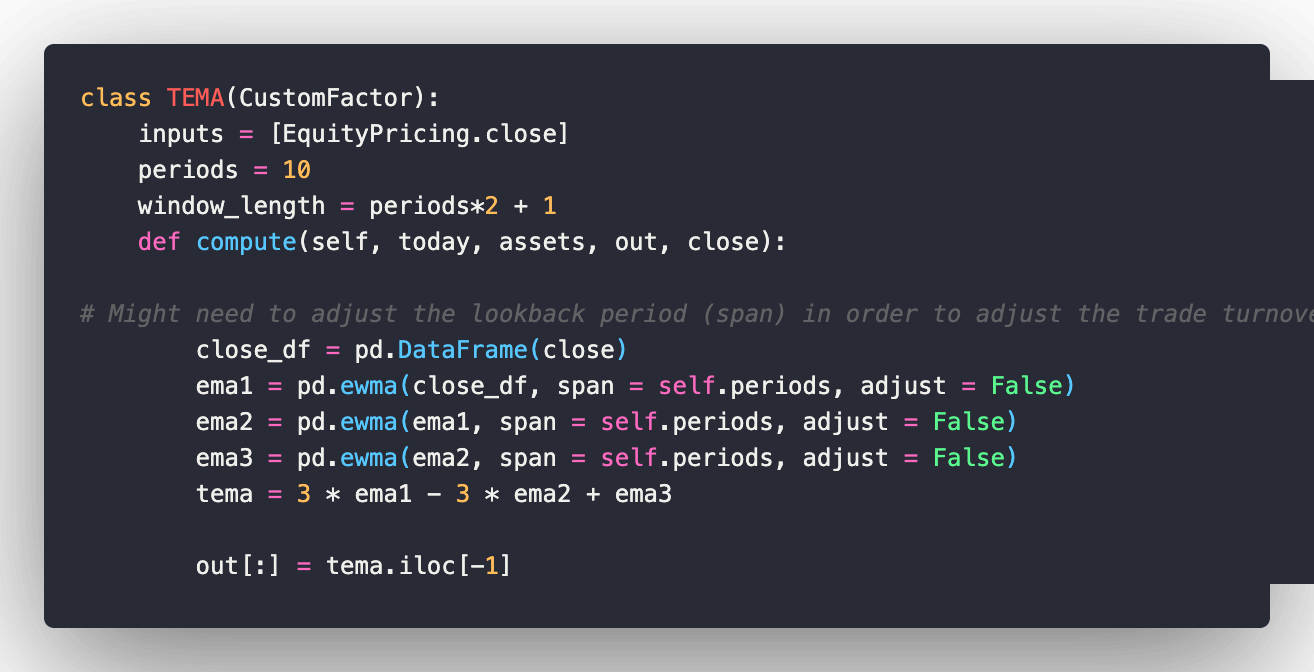
3. Triple Exponential Moving Average (TEMA)
TEMA is a more complex indicator. TEMA smooths the price fluctuations and waives the lagged price impact from the traditional moving average(MA). Compares to EMA, TEMA reduces the influence magnitude of the past few days. Therefore, it works like the traditional moving average to reflect the stock price moving trend by factoring the price movement of the past N periods. We use this to see when the current stock price cross above the TEMA, as a signal of the upward breakthrough.
$TEMA = 3 \times EMA_1 - 3 \times EMA_2 + EMA_3$
$where$
$EMA_1 = Exponential Moving Average (EMA)$
$EMA_2 = EMA of EMA_1$
$EMA_3 = EMA of EMA_2$
Code in python:
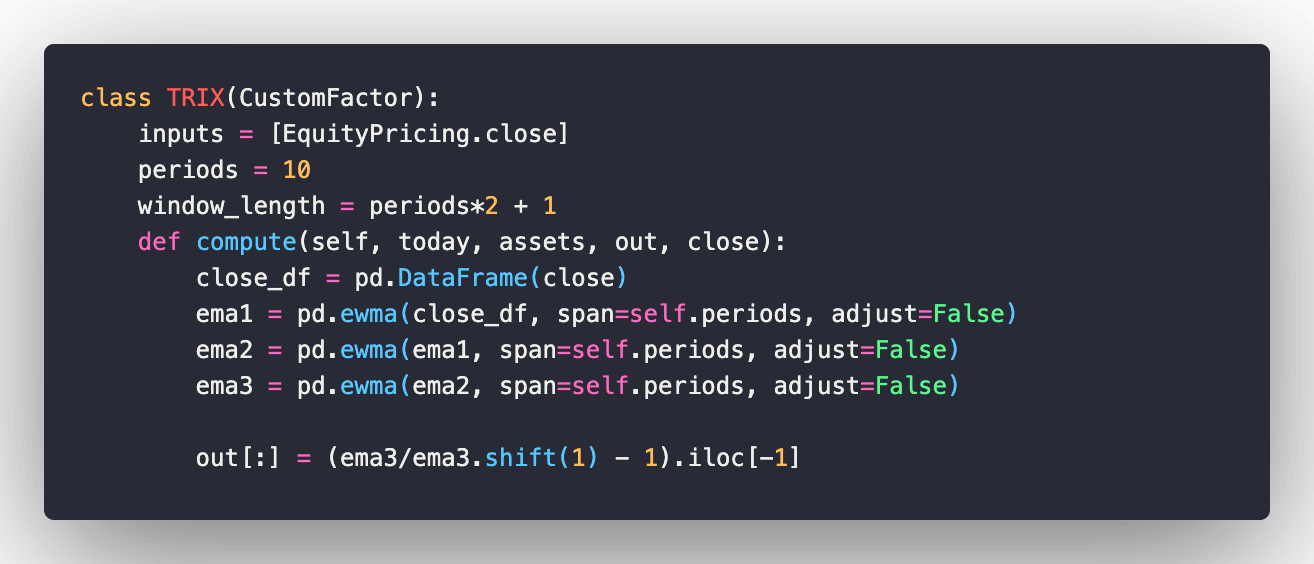
4. Triple Exponential Average (TRIX)
Similarly to TEMA, TRIX is working surrounding the concept of exponential average. It does have one distinct difference. Unlike TEMA, TRIX represents the change in percentage comparing to the previous day, rather than the stock price EMA itself. Change in percentage would help identify the magnitude of either growth or decline. We are going to adopt this into our buy-in signal when the TRIX line goes above the zero-line.
$EMA_{1(i)} = EMA(Price, N, 1)$
$where$
$Price_{(i)} = Current\,price$
$EMA_{1(i)} = The\,current\,value\,of\,the\,Exponential\,Moving\,Average$
$EMA_{2(i)} = EMA(EMA_1, N, i)$
$EMA_{3(i)} = EMA(EMA_2, N, i)$
$TRIX_{(i)} = \frac{EMA_{3(i)} - EMA_{3(i-1)}}{EMA_{3(i-1)}}$
Code in python:
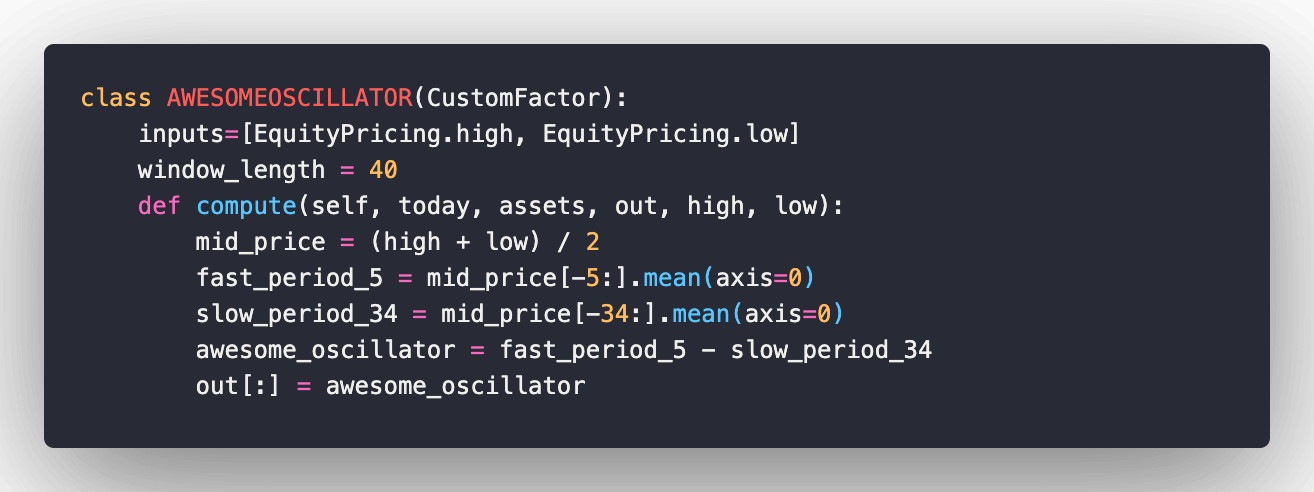
5. Awesome Oscillator
According to the article Awesome Oscillator Day Trading Strategies, the awesome oscillator is quite awesome, or to say it’s amazing. First of all, the awesome oscillator is a boundless oscillator, comparing to the traditional oscillator that ranges from +100 to -100. Secondly, it’s less complex in terms of equation computation, as TRIX modified the concept of normal SMA strategy from using the close price to using the middle price in an intraday. To incorporate the awesome oscillator into our MACD trading strategy, we need both MACD and awesome oscillator signals to be triggered in order to enter or close the positions.
$SMA_{Fast\,Period} = Simple\,Moving\,Average(\frac{(High - Low)}{2}, 5\,periods)$
$SMA_{Slow\,Period} = Simple\,Moving\,Average(\frac{(High - Low)}{2}, 34\,periods)$
$Awesome\,Oscillator = SMA_{Fast\,Period} – SMA_{Slow\,Period}$
Code in python:
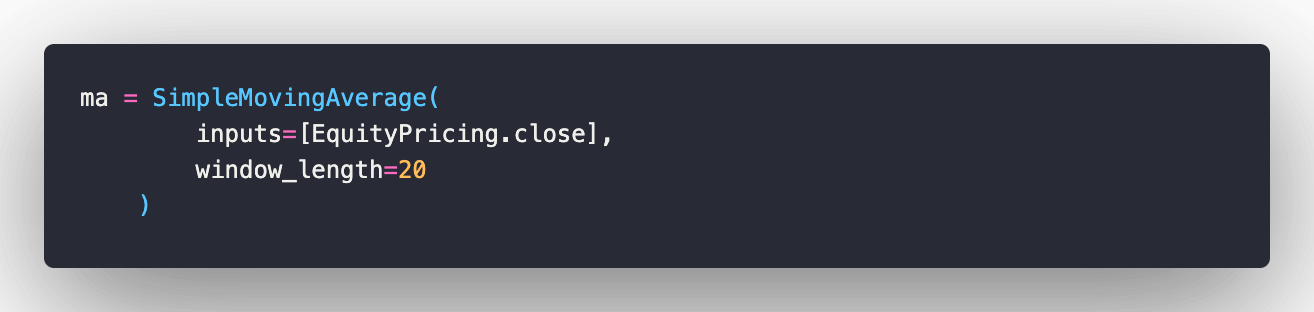
6. Simple Moving Average
This strategy was mentioned in the article MACD – 5 Profitable Trading Strategies as a bouns strategy to look at. In this strategy, we enter a position when the MACD signal is triggered, and then we look for the timing with the assistance of the MA line. Meaning, we buy only when the following conditions are met:
- The stock price is above MA most of the time
- MACD has already crossed above the MACD signal line
- The most recent stock price slide and touched the MA line.
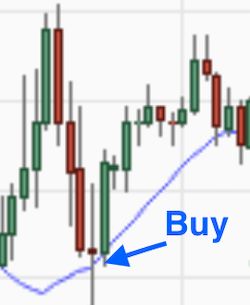
Allegedly, this strategy would get us to buy into the pullbacks of security that still has strong upward momentum.
Code in python:
Performance
The long and tedious description section is over!! Now let’s put the result together and see how each strategy performed.
| Secondary indicators | Diagram | Stats |
|---|---|---|
| RVI | 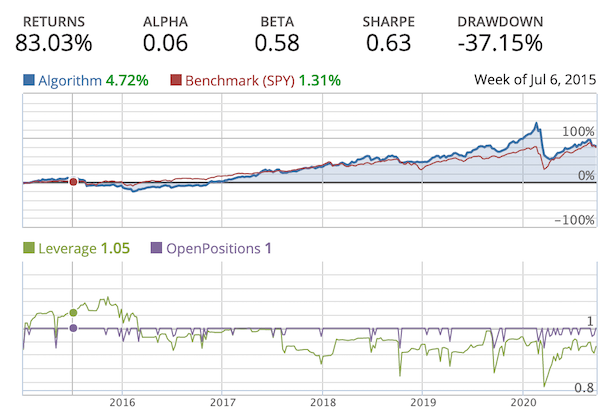 |
By looking at the return line chart, we see that our strategy was actually beaten by the market for a long period of time, from the middle of 2015 to the beginning of 2018. Even though we have generated 80%+ return over a five-year span, this strategy doesn’t look good on the overall Sharpe ratio and max dropdown. |
| MFI | 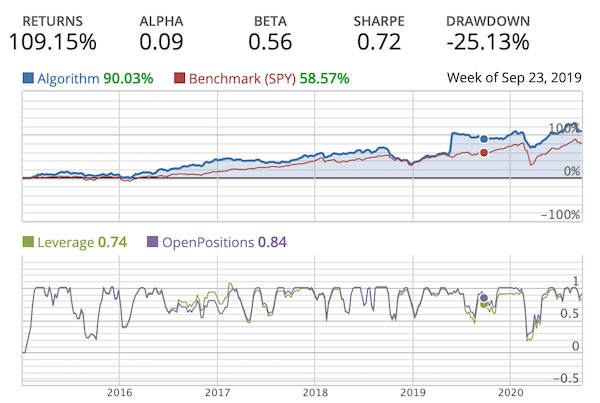 |
MFI strategy did beat the market most of the time and reaches 100%+ return over 5 years. It performed slightly better than the RVI strategy. One thing you noticed in the bottom line chart, that the open position and the leverage ratio fluctuate very often. This could be a sign that the strategy generated too many false alarms. |
| TEMA | 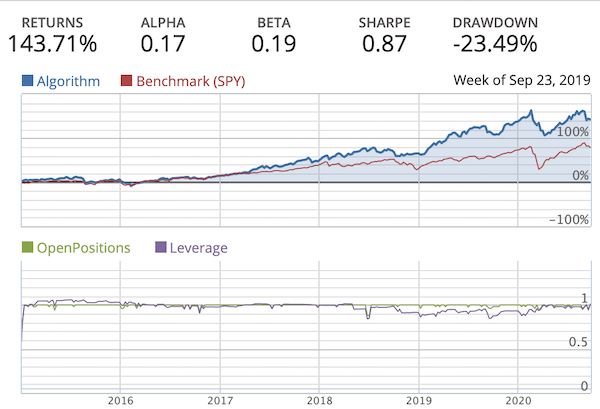 |
The backtest generated the highest alpha, lowest beta, and the smallest max dropdown among all secondary indicators. It also produces 143%+ return over 5 years. It could be a good choice to automate this into a trading bot program to test as it receives the least impact from the market factors. |
| TRIX | 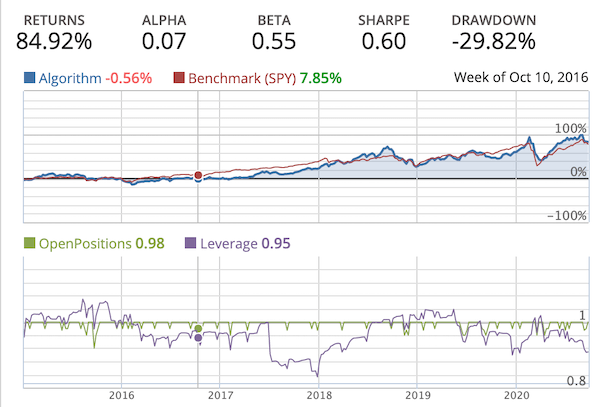 |
As a mutation of the TEMA, TRIX doesn’t perform better than the results generated from TEMA. Change in percentage of EMA might not be able to point out what’s the upward trend. We could play with the TRIX threshold and replace the zero line with other numbers. But I don’t want to do this at the moment, preventing overfitting the model. |
| Awesome Oscillator | 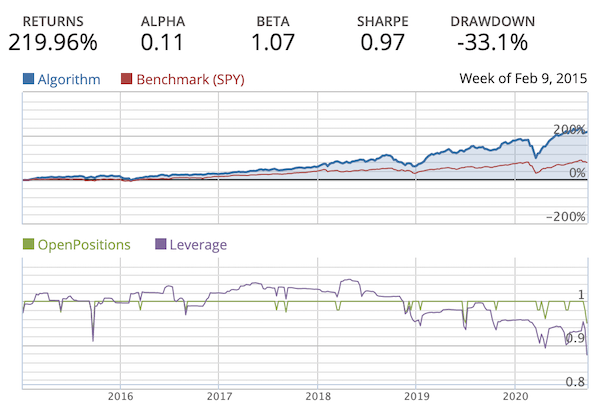 |
This strategy with Awesome Oscillator gives us the highest return and Sharpe ratio. Even though the beta and the max dropdown are both high comparing to the other five strategies, the line chart did clearly represents that this strategy can constantly beat the benchmark(SPY) return. |
| SMA | 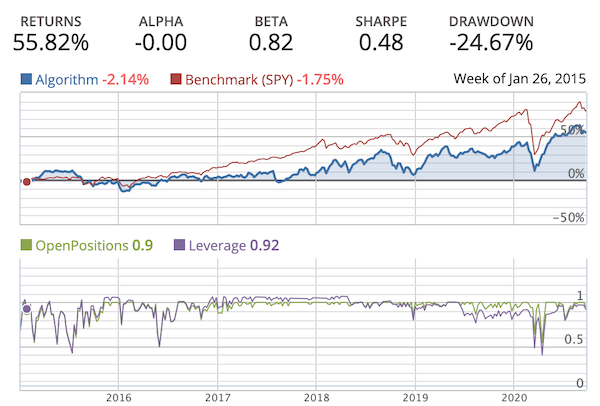 |
This is the only that strategy doesn’t work like the rest. As clearly pointed out in the explanation of the previous paragraph, that it is the strategy tries to capture the bounce back from the pullbacks instead of capturing the momentum. So I would say this test is not mature enough and can dive into this in the next article. |
Summary
- The final results don’t seem to be consistent with the author of MACD – 5 Profitable Trading Strategies on the preferred MACD strategy, as he’s doing research on single stock respectively against the technical diagram. Here we’re working with the computer, screening qualified stocks, and letting the program to decide what to buy and when to buy or sell.
- From what we have tested, TEMA and Awesome Oscillator seem to be the best options out of 6 strategies that we have backtested. These two strategies have generated outstanding return and Sharpe ratio, and also be able to beat the benchmark stock SPY.
- As we’re running the stock selection by programmed rules, there could be many stocks that have passed the threshold and qualified to be traded. Since we have only 10 seats in our portfolio, how are we going to select the stock that has the biggest momentum? The MACD nor the rest of the secondary indicators can be used to define the magnitude of the momentum across different stocks. However, it seems that high P/B ratio tends to receive higher influence from the momentum factor. When ranking the P/B ratio from high to low would generate a higher return and lower risk compared to ranking the P/B ratio from low to high. I will not spend more words on describing this in this article. If anyone is interested in this topic, let me know, and I’ll write more about this.
Take away
There are still many other variables to play with in order to optimize the strategy. Such as increase the MACD threshold to make sure we don’t run into a short-term reverse, increase the portfolio capacity to waive the sector-specific risk, monitor the MACD breakthrough for several periods to confirm the upward/downward trend before opening a position, … etc.. However, looking from the MVP (minimum viable product) point of view, I believe it’s already good enough to throw this into practice by picking either TEMA or Awesome Oscillator strategies.
OK. I’m going to write my code to start trading automatically. See you next time.
Reference
- MACD – 5 Profitable Trading Strategies
- RVI 活力指標
- Money Flow Index Strategy
- Money Flow Index - MFI
- TEMA
- TRIX wiki
- TRIX investopedia
- Awesome Oscillator
- MACD+MA Indicator Combination Strategy
- Algorithmic Trading Strategy Using MACD and MA
- A deeper look at how momentum strategies work
- Introduction to momentum trading
- Momentum factor effect in stocks


