
Cover image created through Copilot
Traditional grid trading systems, despite their popularity, face critical limitations with static price levels and poor performance in trending markets. Also, the vulnerability to sudden market gaps and the inability to adapt to changing market volatility is another huge obstacle. Given the promising and speedy advance in both hard and software of machine learning, Francesco Rundo, *Francesca Trenta, Agatino Luigi di Stallo, and Sebastiano Battiato* in the article Grid Trading System Robot (GTSbot): A Novel Mathematical Algorithm for Trading FX Market proposed a new type of Grid Trading System that solves the challenges of the traditional one. This system dynamically optimizes entry/exit points and adapts to market conditions in real-time, maximizing profit potential while managing risks. Join me as I break down the complete process, from data preparation to model training, and reveal how you can implement this advanced trading strategy yourself.
Previous readings
- 【How 2】Explain Bayes’ Theorem Without Using Big Words
- Looking for no-loss trading strategy? Here’s the strategy that you should look at
- 【Pair Trading】 Complete Guide to Backtest Cointegration Pair Trading Strategy
Summary of the GTSbot paper
We have discussed the traditional grid trading system in my previous post Looking for no-loss trading strategy?. The traditional grid trading strategy seems to be a good trading strategy that it always tries to buy low and sell high. However, when the stationary property of the time series, which is the core value of this strategy, cannot hold anymore, the strategy will turn into a show ruiner. This is usually due to the global market trading regime or a country’s central bank policy change.
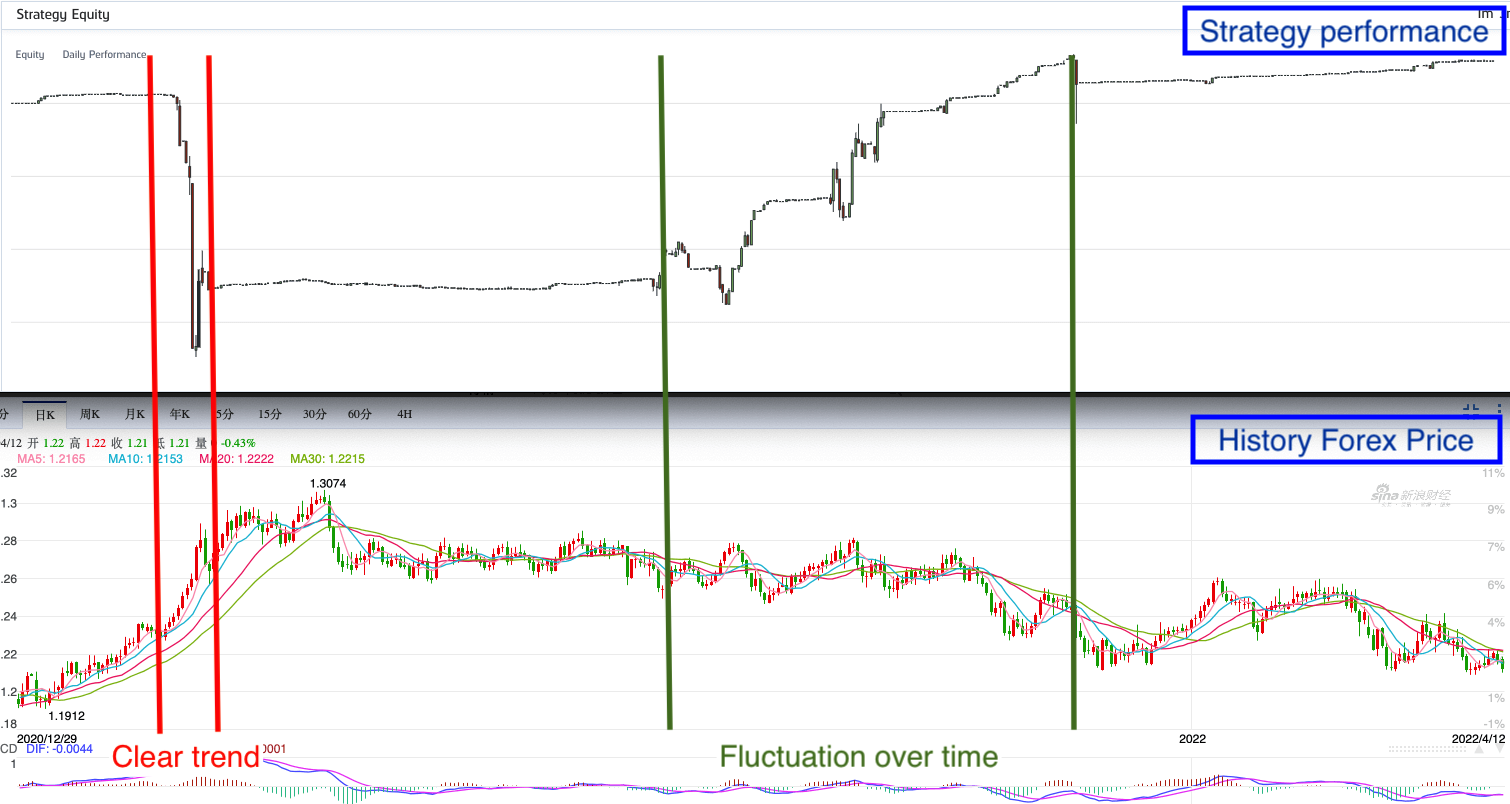
Drastic change of the market trend sabotages the accumulated strategy returns
In the paper Grid Trading System Robot (GTSbot): A Novel Mathematical Algorithm for Trading FX Market, the authors proposed a new type of Grid Trading System that solves the challenges of the traditional one. This system dynamically optimizes entry/exit points and adapts to market conditions in real-time, maximizing profit potential while managing risks. Therefore, compared to the traditional grid trading system, the GTSbot no longer relies on stagnant price levels as the baseline to define the grids. Instead, it employs a regression network to predict future price movement, building the various grids with different reference prices simultaneously. This system offers the performance similar to the Ichimoku FX trading strategy as high as 13.76% ROI over the backtest period, but also greatly reduces the Max DD to one fifth of Max DD generated by the benchmark strategy.
What is GTSbot
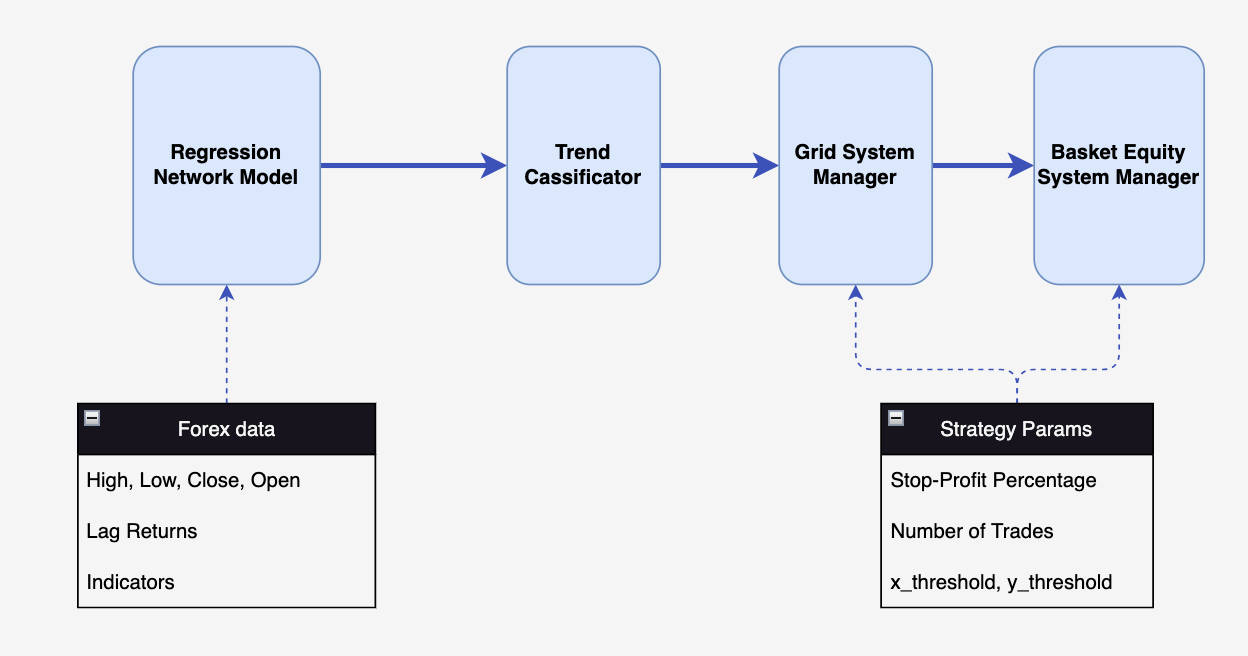
The containing models of the GTSBot
The diagram above briefly demonstrates the architecture of the GTSbot. The GTSbot is composed of the following four main components:
1. Regression Network:
This component is responsible for predicting future price movement using the Forex pricing data. However, to predict the exact price is not the goal of this model. The aim is to use the combination of predicted future price and the historical data to determine the future trend so that we can decide either conduct long or short trades. The model proposed in the paper is called Scaled Conjugate Gradient (SCG) where introduces in A scaled conjugate gradient algorithm for fast supervised learning by _Martin Fodslette Moller_ to accelerate the time needed to train the model to reach global minima.
I spent some time to find the find the source code and made a few adjustments for this model to work. It works perfectly and greatly reduces the time needed for train the model. However, I found that you won’t be able to load this model on QuantConnect platform to conduct further backtest in order to obtain a more accurate backtest result. Therefore, I fallback to the Long Short-Term Memory (LSTM) model, which is the most popular model for time series forecasting. Below is the structure of the LSTM model that I use.
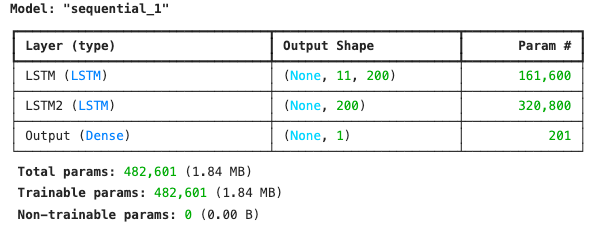
The structure of the LSTM model
The RMSE validation result is as below:
Vest Validation RMSE: 0.0126%
2. Trend Classification Block (TCB):
This component classifies the current trend based on the predicted price movement. It uses the output of the regression network to determine whether the trend is bullish, bearish, or neutral. As we learned in school’s physics class, there is a great chance that the we’re going to see a positive momentum if both the speed and the acceleration is positive, and vice versa. Here we use the differential of the price formula as the speed parameter and its second differential as the acceleration parameter. According to the Central Difference Quotien and Second Central Difference Approximation rules, we can simplify these differentials into following formula:
Using the above rules, let’s add the data we have and predicted to rewrite these equations:
Once we confirm that both these two differentials are positive, we can conclude that the price is going to increase and send the bullish signal to the next component to open a long trade. If both differentials are negative, send the bearish signal to the next component to open a short trade. If none of the above conditions met, we consider the market is still volatile and won’t send the signal to the next component to open any trade.
3. Grid System Manager Block (GSM):
Once this component receive either bullish or bearish signal from the TCB and then place long/short trades accordingly. It will do a few check before placing any trade:
- We set the maximum holding positions of this strategy to be 15. In the paper also mentioned that this number is preferably to be an odd number, so that the long and short positions ca offset each other.
- We define x_threshold to be 15 (samples), meaning that we won’t open a new trade until 15 minutes after our previous opened trade. This is to make sure that we don’t overtrade our capital in one single upward or downward trend.
- We set y_threshold to 2 (pips). We need to make sure that the new trade we open is above all the previous long trades at least 2 pips, or below all the previous short trades at least 2 pips. In essence, this is the grid size of this trading system.
4. Basket Equity System Manager (BESM):
Lastly, the BESM component act essentially as a risk management component. It monitors each opened positions and will close them once hitting the take-profit points. Interestingly, the paper mentioned that the BESM component is specifically designed not to set any stop-loss points. The authors believe that this new type of grid system would open an opposite trade to compensate the wrongly opened trade when the TCB component realize the trend is turning around.
Let’s see how to can backtest this strategy to examine its performance against the real world.
How to implement this GTSbot?
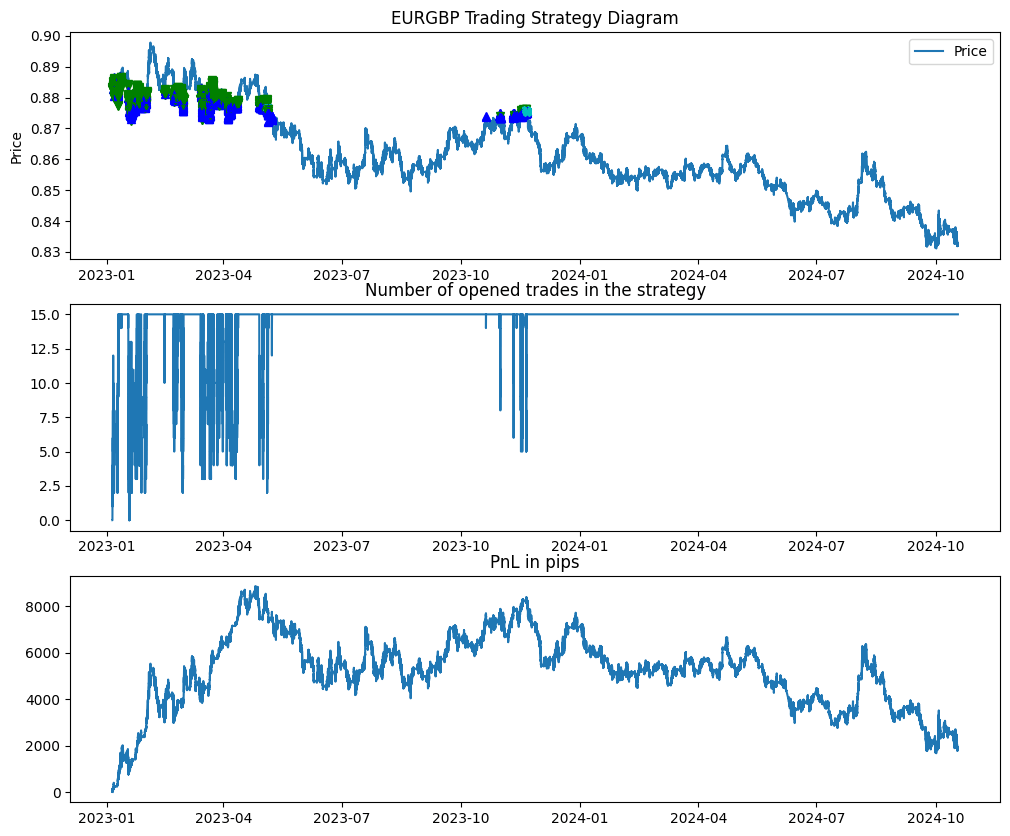
Final backtest strategy performance
Conclusion
The strategy seems to be very profitable in the beginning half a year. However, as we all know that this strategy lacks the proper stop-loss point for each trade, so these trades get stuck in the market for a long time at one point. This results leaves us a lot of room to further improve this strategy:
- Instead of simply adding a stop-loss point, we can adopt the Triple Barrier Method technique mentioned in this post to confine the risk of each trade.
- You can’t place both long and short order on QuantConnect system as the forex trades will net themselves off. Due to this reason, we can’t use QuantConnect to further backtest this strategy.
- You CAN place both long and short order via FXCM. However, it doesn’t provide a simulation platform to conduct backtest against the price history.
- FXCM provides the API and DEMO account so that you can build a simulation backtest in paper trading. Yet building this tool takes a lot of effort
I wouldn’t judge this strategy as either a good or bad one. However, this paper does provide us a tons of ideas to rethink what a grid trading system can and should do. I hope you enjoy reading this paper as much as I do.


